Remove Big Data Remove Data Processing Remove Interactive Remove KPI
article thumbnail

How To Improve Your Facility Management With Healthcare Reports

datapine

We’ve delved into the impact of big data in healthcare. Healthcare reports can help reduce errors, enhance the acquisition of vital patient data, reduce needless expenditure, and improve healthcare processes exponentially. Hospital KPI dashboard. Main hospital dashboard KPIs. click to enlarge**.

Reporting 198
article thumbnail

An Introduction To Data Dashboards: Meaning, Definition & Industry Examples

datapine

Learn all about data dashboards with our executive bite-sized summary! What Is A Data Dashboard? Now that you understand a clearly defined dashboard meaning, let’s move onto one of the primary functions of data dashboards: answering critical business questions. How Data Dashboards Are Used In BI. They Are Interactive.

Insiders

Sign Up for our Newsletter

This site is protected by reCAPTCHA and the Google Privacy Policy and Terms of Service apply.

Trending Sources

article thumbnail

Utilize The Effectiveness Of Professional Executive Dashboards & Reports

datapine

Without big data analytics, companies are blind and deaf, wandering out onto the Web like deer on a freeway. Companies that use data analytics are five times more likely to make faster decisions, based on a survey conducted by Bain & Company. Management KPI Dashboard. What Is Executive Dashboard Reporting?

article thumbnail

Take Advantage Of The Top 16 Sales Graphs And Charts To Boost Your Business

datapine

8) Revenue And Sales Interactive Management Overview. This is a really fun interactive sales graph, as it lets you see your revenue and sales according to different time periods that you select. A revenue graph that is worth exploring on a monthly basis by utilizing a modern KPI reporting software. 11) Sales KPI Dashboard.

Sales 235
article thumbnail

Get Started With Business Performance Dashboards – Examples & Templates

datapine

In fact, according to eMarketer, 40% of executives surveyed in a study focused on data-driven marketing, expect to “significantly increase” revenue. Not to worry – we’ll not only explain the link between big data and business performance but also explore real-life performance dashboard examples and explain why you need one (or several).

article thumbnail

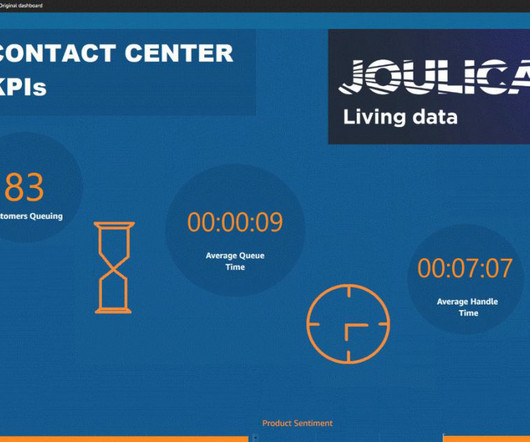
Joulica unifies real-time and historical customer experience analytics with Amazon QuickSight

AWS Big Data

Our founders previously led contact center research and development for a global contact center technology provider, and we founded Joulica because we saw that the shift to the cloud and growing demand for data and analytics would transform the customer service industry. To learn more about Joulica, please visit Joulica.io.

article thumbnail

How to achieve Kubernetes observability: Principles and best practices

IBM Big Data Hub

Kubernetes schedules and automates container-related tasks throughout the application lifecycle, including: Deployment Kubernetes can deploy a specific number of containers to a specific host and keep them running in their desired state. However, unlike VMs, Kubernetes orchestrates container interactions that transcend apps and clusters.

Metrics 73