Remove Broadcasting Remove Business Intelligence Remove Dashboards Remove Reporting
article thumbnail

Sport analytics leverage AI and ML to improve the game

CIO Business Intelligence

The insights are then provided to the team captain via a dashboard on Microsoft Surface devices. With this huge amount of data per month, we’re able to offer stats and reports,” says Ana Rosa Victoria Bruno, innovation manager at LaLiga. Bruno’s advice: Create a multidisciplinary team.

Analytics 107
article thumbnail

LaLiga transforms fan experience with AI

CIO Business Intelligence

Insights gleaned from Mediacoach are intended for technical staff—coaches and doctors, for example—but LaLiga has also created Beyond Stats, a portal powered by Mediacoach that packages and presents data for media and fans via a range of accessible dashboards. “We million data points per match.

Insiders

Sign Up for our Newsletter

This site is protected by reCAPTCHA and the Google Privacy Policy and Terms of Service apply.

article thumbnail

Bubble Wrap: How Eurovision Monitors Covid Risk at Events

CIO Business Intelligence

The Eurovision Song Contest, by the way, is the world’s largest live music event, organized each year in May by the local organizer and the European Broadcasting Union. Flockey provides his team with a dashboard for real-time visualization of crowd movement and risks. A New Normal: Bubble-Up for Safety at Live Events with Flockey.

Risk 94
article thumbnail

MLSE looks to revolutionize sports experience with digital R&D lab

CIO Business Intelligence

One of the first concepts developed by the program while under pilot was the NHL Extended Reality Stats Overlay, which uses extended reality to deliver broadcast and video game capabilities to people watching games in-person. But that risk has come with a commensurate reward. It’s become a statement by the organization about its priorities.

article thumbnail

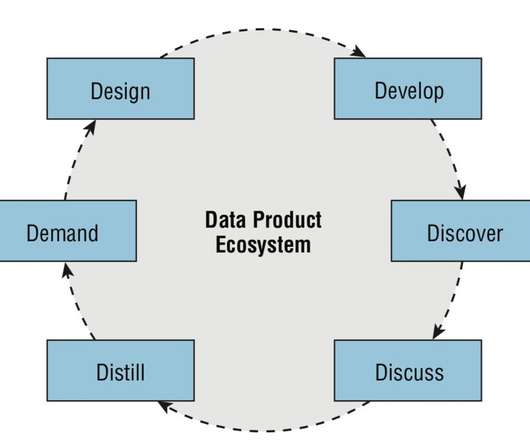
Keys to Data Fluency: Creating the Data Product Ecosystem

Juice Analytics

In fact, for most organizations, the collection of dashboards, reports, and analysis tools feels like a chaotic mess. Less than 30 percent of the potential users of organizations’ standard business intelligence (BI) tools use the technology today. Some organizations consider data products a one-way information broadcast.