article thumbnail

Bubble Wrap: How Eurovision Monitors Covid Risk at Events

CIO Business Intelligence

The Eurovision Song Contest, by the way, is the world’s largest live music event, organized each year in May by the local organizer and the European Broadcasting Union. Flockey provides his team with a dashboard for real-time visualization of crowd movement and risks. A New Normal: Bubble-Up for Safety at Live Events with Flockey.

Risk 97
article thumbnail

LaLiga transforms fan experience with AI

CIO Business Intelligence

Insights gleaned from Mediacoach are intended for technical staff—coaches and doctors, for example—but LaLiga has also created Beyond Stats, a portal powered by Mediacoach that packages and presents data for media and fans via a range of accessible dashboards. “We We followed the design thinking process,” says Bruno. “We

Insiders

Sign Up for our Newsletter

This site is protected by reCAPTCHA and the Google Privacy Policy and Terms of Service apply.

article thumbnail

Sport analytics leverage AI and ML to improve the game

CIO Business Intelligence

The insights are then provided to the team captain via a dashboard on Microsoft Surface devices. The platform uses ball-tracking cameras and 3D radar systems to generate live on-court match data, which is fed into Azure and combined with live score data to reveal insights into serving patterns, returns, and player movements around the court.

Analytics 112
article thumbnail

The Importance of Data Analytics with IPTV Middleware CMS

Smart Data Collective

It is impossible to build an IPTV/OTT platform without IPTV middleware software, given that the IPTV middleware CMS determines the transmission logic, DRM quality, and control, usage analytics and reports, user data and statistics collection, dashboard, intuitive administrations interface, control algorithm, and more of your platform.

article thumbnail

How Data Storytelling Can Build Better Customer Connections

Juice Analytics

Twitter is encouraging activity by making their first reported measure ‘number of Tweets.’. Frameworks like the “North Star Metric” force a product organization to understand the key measures of customer value. Densely packed dashboard. Is the data story a collaboration or a one-way broadcast? Tables of data.

article thumbnail

Take Advantage Of Professional Social Media Reports – Examples & Templates

datapine

By using social media management reporting software to track, measure, and refine your socially-driven efforts, you will make better, swifter, and more informed decisions while maximizing your ROI with every initiative or interaction you make. With the help of an online data analysis tool , this targeting can be built up significantly.

Reporting 178
article thumbnail

Krones real-time production line monitoring with Amazon Managed Service for Apache Flink

AWS Big Data

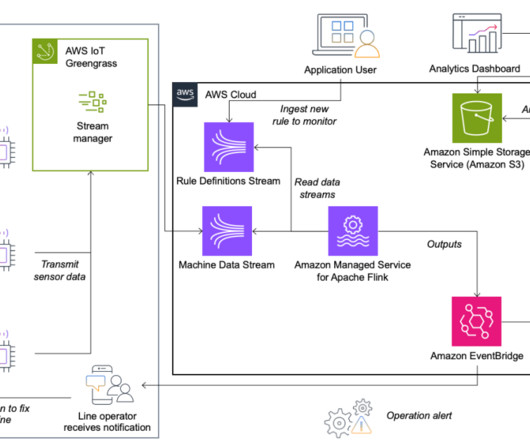
Watermarks A watermark is a mechanism used to track and measure the progress of event time in a data stream. In this section, we dive deeper into the keyed state and broadcast state in Apache Flink and how they’re used to build the Krones rule engine. We explain how to solve this in the next section, where we talk about watermarks.