Remove Business Analysis Remove Dashboards Remove Marketing Remove Reference
article thumbnail

IT Dashboard: Supporter to Harness Information Technology

FineReport

Information technology (IT) dashboard helps release your pressure by harnessing IT effectively. IT dashboard: definition & design. What is IT dashboard? IT dashboard is a business intelligence tool for efficiently tracking KPIs. A cartoon of people using investment dashboard. IT dashboard software.

article thumbnail

Why Dashboard Visualization Matters in the 21st century?

FineReport

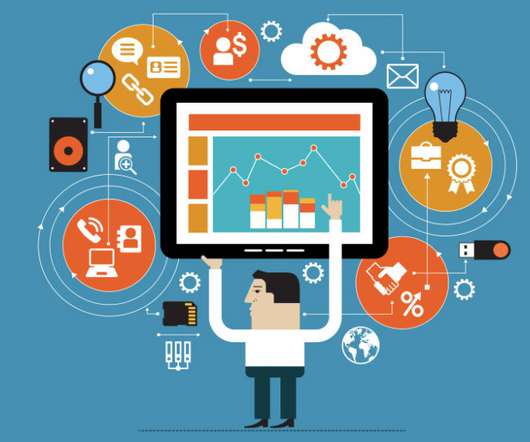
Data dashboard visualization plays a key role in business, whether about analysis or decision. Now, let’s explore the dashboard visualization! What is Dashboard Visualization? dashboard visualization (by Finereport?. dashboard visualization (by Finereport?. Just a link to their dashboards!

Insiders

Sign Up for our Newsletter

This site is protected by reCAPTCHA and the Google Privacy Policy and Terms of Service apply.

Trending Sources

article thumbnail

Business Intelligence Examples Show You the Real BI World

FineReport

With the aid of business intelligence, it’s helpful to make business analysis and decision. Business intelligence will clearly present market proportion, supply chain distribution and other key indicators with charts and numbers. Supply Chain Dashboard (by FineReport). Cost Analysis (by FineReport).

article thumbnail

Business Report: Definition, Types, Samples, and How to Create it?

FineReport

Fortunately, some business reports and business dashboards successfully overcome these weak points. Therefore, it is necessary for you to have a basic understanding of these newly-developed business reports and dashboards, which will improve your efficiency in creating and reading business reports.

article thumbnail

Top 6 Data Analytics Tools in 2019

FineReport

And I am trying to talk objectively with you about my personal views on data analysis tools on the market, for your reference. Now let’s compare the three popular BI tools on the market: Power BI, FineReport, and Tableau. It entered the BI market earlier and carried forward this core value. R & Python.

article thumbnail

Your Data Won’t Speak Unless You Ask It The Right Data Analysis Questions

datapine

But if you find a development opportunity, and see that your business performance can be significantly improved, then a KPI dashboard software could be a smart investment to monitor your key performance indicators and provide a transparent overview of your company’s data. 5) Which statistical analysis techniques do you want to apply?

IT 317
article thumbnail

10 Best Dashboard Design Tips, Templates & How-To’s

FineReport

The most predominant means to visualize data is the application of various dashboards. The dashboard design has naturally become an important point that cannot be ignored. Many people are not very confident in designing an effective dashboard. Dashboard Design Tips. Sales dashboard by FineReport.