Remove Business Intelligence Remove Data Processing Remove Structured Data Remove Visualization
article thumbnail

Introduction To The Basic Business Intelligence Concepts

datapine

This concept is known as business intelligence. Business intelligence, or “BI” for short, is becoming increasingly prevalent across industries each year. But with business intelligence concepts comes a great deal of confusion, and ultimately – unnecessary industry jargon. Learn here! But more on that later.

article thumbnail

Quantitative and Qualitative Data: A Vital Combination

Sisense

Most commonly, we think of data as numbers that show information such as sales figures, marketing data, payroll totals, financial statistics, and other data that can be counted and measured objectively. This is quantitative data. It’s “hard,” structured data that answers questions such as “how many?”

Insiders

Sign Up for our Newsletter

This site is protected by reCAPTCHA and the Google Privacy Policy and Terms of Service apply.

article thumbnail

Seize The Power Of Analytical Reports – Business Examples & Templates

datapine

In recent years, analytical reporting has evolved into one of the world’s most important business intelligence components, compelling companies to adapt their strategies based on powerful data-driven insights. A modern data report offers a host of interactive data charts and visualizations you can use to your advantage.

Reporting 245
article thumbnail

The new challenges of scale: What it takes to go from PB to EB data scale

CIO Business Intelligence

Admittedly, it’s still pretty difficult to visualize this difference. Consider data types. How is it possible to manage the data lifecycle, especially for extremely large volumes of unstructured data? Here is how Cloudera visualizes and controls the data lifecycle. Let’s take it to space.

article thumbnail

Build a data storytelling application with Amazon Redshift Serverless and Toucan

AWS Big Data

Business intelligence (BI) with dashboards, reports, and analytics remains one of the most popular use cases for data and analytics. It provides business analysts and managers with a visualization of the business’s past and current state, helping leaders make strategic decisions that dictate the future.

article thumbnail

How smava makes loans transparent and affordable using Amazon Redshift Serverless

AWS Big Data

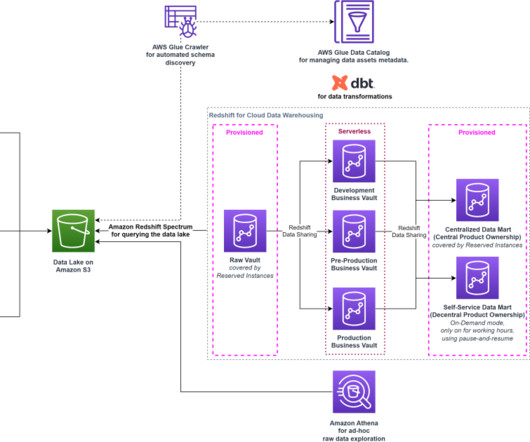
For the downstream consumption by all departments across the organization, smava’s Data Platform team prepares curated data products following the extract, load, and transform (ELT) pattern. This is the Data Mart stage. The data products from the Business Vault and Data Mart stages are now available for consumers.