article thumbnail

Get The Most Out Of Smart Business Intelligence Reporting

datapine

Spreadsheets no longer provide adequate solutions for a serious company looking to accurately analyze and utilize all the business information gathered. That’s where business intelligence reporting comes into play – and, indeed, is proving pivotal in empowering organizations to collect data effectively and transform insight into action.

article thumbnail

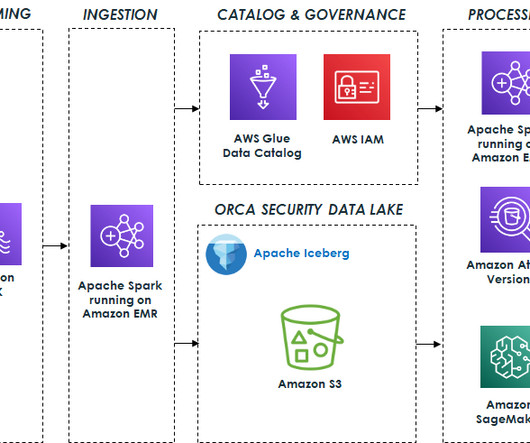
Orca Security’s journey to a petabyte-scale data lake with Apache Iceberg and AWS Analytics

AWS Big Data

Prior to the creation of the data lake, Orca’s data was distributed among various data silos, each owned by a different team with its own data pipelines and technology stack. Moreover, running advanced analytics and ML on disparate data sources proved challenging.

Insiders

Sign Up for our Newsletter

This site is protected by reCAPTCHA and the Google Privacy Policy and Terms of Service apply.

Trending Sources

article thumbnail

Data Observability and Monitoring with DataOps

DataKitchen

Figure 1: The process of transforming raw data into actionable business intelligence is a manufacturing process. When something goes wrong, you need to know about it as it’s happening to ensure that errors don’t reach customers or business partners. It’s not about data quality . It’s not only about the data.

Testing 214
article thumbnail

Power enterprise-grade Data Vaults with Amazon Redshift – Part 2

AWS Big Data

Through Amazon Redshift in-memory result set caching and compilation caching, workloads ranging from dashboarding to visualization to business intelligence (BI) that run repeat queries experience a significant performance boost. Automated snapshots retain all of the data required to restore a data warehouse from a snapshot.

article thumbnail

Accelerate Your Business Performance With Modern IT Reports

datapine

Just like you would answer “I am a bit stressed” or “tired but happy” to someone asking how you feel, without giving them the blow-by-blow account of everything that happened throughout the week, a report gives a snapshot of the activities.

Reporting 173
article thumbnail

Financial Dashboard: Definition, Examples, and How-tos

FineReport

Furthermore, we will introduce some business intelligence solution that excels in simplifying the process of creating and utilizing a financial dashboard effectively. Finance and accounting teams often deal with data residing in multiple systems, such as accounting software, ERP systems, spreadsheets, and data warehouses.

article thumbnail

Take Advantage Of The Top 16 Sales Graphs And Charts To Boost Your Business

datapine

A sales growth graph that will help make your business robust, adaptable, and of course—profitable. Number 6 on our list is a sales graph example that offers a detailed snapshot of sales conversion rates. that Increasing revenue in a sales-based business can come from several areas, broadly speaking. 6) Sales Conversion.

Sales 235