article thumbnail

Data Visualization Libraries to Enhance Your Custom Analytics

Sisense

The world of data visualization is constantly evolving. If you’re reading this, it’s likely for one of two reasons: You need a visualization library for your project, or you’re curious about what’s changed since 2020 in terms of visualization libraries. Data visualizations are a vital part of embedded analytics.

article thumbnail

Interview with: Sankar Narayanan, Chief Practice Officer at Fractal Analytics

Corinium

Therefore, understanding customers for cross and up-sell is paramount. Fractal’s recommendation is to take an incremental, test and learn approach to analytics to fully demonstrate the program value before making larger capital investments. Build multiple MVPs to test conceptually and learn from early user feedback.

Insurance 250
Insiders

Sign Up for our Newsletter

This site is protected by reCAPTCHA and the Google Privacy Policy and Terms of Service apply.

Trending Sources

article thumbnail

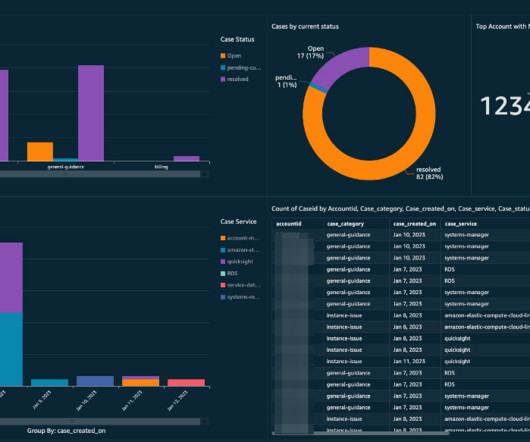
Create a comprehensive view of AWS support cases with Amazon QuickSight

AWS Big Data

This post describes how Amazon QuickSight dashboards can help you visualize your support cases in a single pane of glass using data extracts from Systems Manager. QuickSight meets varying analytic needs from the same source of truth through modern interactive dashboards, paginated reports, embedded analytics, and natural language queries.

article thumbnail

Decoding Data Analyst Job Description: Skills, Tools, and Career Paths

FineReport

They analyze, interpret, and manipulate complex data, track key performance indicators, and present insights to management through reports and visualizations. Technically, analysts must excel in numerical and analytical skills, advanced Excel usage, and an understanding of relational databases like MS Access.

article thumbnail

What Is Embedded Analytics?

Jet Global

Bottom line is that analytics has migrated from a trendy feature to a got-to-have. Plus, there is an expectation that tools be visually appealing to boot. In the past, data visualizations were a powerful way to differentiate a software application. Their dashboards were visually stunning. It’s all about context.

article thumbnail

An In-Depth View of Data Science

Domino Data Lab

They have enabled new cross-industry applications, such as in customer analytics and fraud detection. This includes accessing and preparing data, building and testing models and deploying them into production. The Data Science Toolkit. There are many commercial and open-source packages available for a given task.

article thumbnail

Make or Buy?

Darkhorse

The systems were set up to pay claims and report to customers. Analytics was never considered. Developing analytics to reduce fraud would be a huge competitive advantage if it were successful. Some firms are functional specialists with specific expertise in marketing analytics or HR analytics.