Remove Dashboards Remove Data-driven Remove Interactive Remove Slice and Dice
article thumbnail

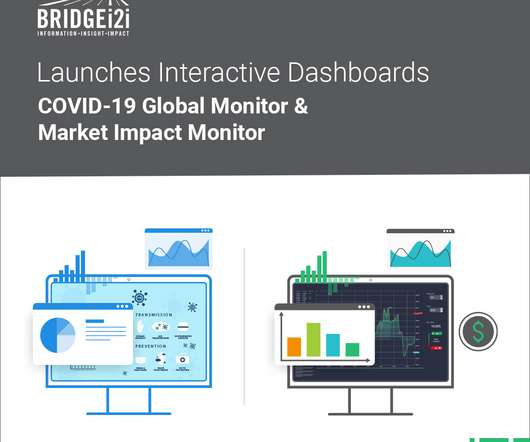
BRIDGEi2i launches two interactive dashboards: COVID19 Global Monitor & COVID Stock Market Impact Monitor

bridgei2i

BRIDGEi2i, a leading AI consultancy, has launched two interactive dashboards that highlight the impact of COVID19 globally across businesses and communities. The Global COVID-19 Monitor gives live insights on the spread of the pandemic across the world and allows you to slice and dice data from many perspectives.

article thumbnail

Trakstar unlocks new analytical opportunities for its HR customers with Amazon QuickSight

AWS Big Data

It’s powered by Amazon QuickSight , a cloud-native business intelligence (BI) tool that enables embedded customized, interactive visuals and dashboards within the product experience. QuickSight allowed us to focus on building dashboards that address key pain points for customers and rapidly innovate.

Insiders

Sign Up for our Newsletter

This site is protected by reCAPTCHA and the Google Privacy Policy and Terms of Service apply.

Trending Sources

article thumbnail

Business Intelligence for Marketing: Offer Efficient Work

FineReport

Business intelligence for marketing is the application of business intelligence in the field of marketing, allowing marketers to collect data, debugging data and processing it out through enterprise resource planning and company strategy. Marketing data visualization display(by FineReport). Sales dashboard (by QlikView).

article thumbnail

Common Business Intelligence Challenges Facing Entrepreneurs

datapine

“BI is about providing the right data at the right time to the right people so that they can take the right decisions” – Nic Smith. Data analytics isn’t just for the Big Guys anymore; it’s accessible to ventures, organizations, and businesses of all shapes, sizes, and sectors. And the success stories are seemingly endless.

article thumbnail

Experimenting to Win with Data

Sisense

When deploying analytics for your company or your customers, you can feel stuck between the twin poles of “What data is available?” The key to coming up with the best insights lies in delving deeply into both questions; the answers you discover can help you get even more out of your data. Determining data goals, making a plan.

article thumbnail

Move Beyond Excel, PowerPoint And Static Business Reporting with Powerful Interactive Dashboards

datapine

Soon businesses of all sizes will have so much amount of information that dashboard software will be the most invaluable resource a company can have. Visualizing the data and interacting on a single screen is no longer a luxury but a business necessity. That’s why we welcome you to the world of interactive dashboards.

article thumbnail

Optimize queries using dataset parameters in Amazon QuickSight

AWS Big Data

Amazon QuickSight powers data-driven organizations with unified business intelligence (BI) at hyperscale. With QuickSight, all users can meet varying analytic needs from the same source of truth through modern interactive dashboards, paginated reports, embedded analytics and natural language queries.