Remove Dashboards Remove Data Enablement Remove Data Processing Remove Marketing
article thumbnail

Move Beyond Excel, PowerPoint And Static Business Reporting with Powerful Interactive Dashboards

datapine

Soon businesses of all sizes will have so much amount of information that dashboard software will be the most invaluable resource a company can have. Visualizing the data and interacting on a single screen is no longer a luxury but a business necessity. That’s why we welcome you to the world of interactive dashboards.

article thumbnail

10 Examples of How Big Data in Logistics Can Transform The Supply Chain

datapine

You can use big data analytics in logistics, for instance, to optimize routing, improve factory processes, and create razor-sharp efficiency across the entire supply chain. The big data market is expected to exceed $68 billion in value by 2025 , a testament to its growing value and necessity across industries. Did you know?

Big Data 275
Insiders

Sign Up for our Newsletter

This site is protected by reCAPTCHA and the Google Privacy Policy and Terms of Service apply.

Trending Sources

article thumbnail

Your Ultimate Guide To Modern KPI Reports In The Digital Age – Examples & Templates

datapine

Typically presented in the form of an interactive dashboard , this kind of report provides a visual representation of the data associated with your predetermined set of key performance indicators – or KPI data, for short. Consider your data sources. Set up a report which you can visualize with an online dashboard.

KPI 223
article thumbnail

13 Analytics & Business Intelligence Examples Illustrating The Value of BI

datapine

Digital data, by its very nature, paints a clear, concise, and panoramic picture of a number of vital areas of business performance, offering a window of insight that often leads to creating an enhanced business intelligence strategy and, ultimately, an ongoing commercial success. billion , growing at a CAGR of 26.98% from 2016.

article thumbnail

Eight Top DataOps Trends for 2022

DataKitchen

The global AI market is projected to grow at a compound annual growth rate (CAGR) of 33% through 2027 , drawing upon strength in cloud-computing applications and the rise in connected smart devices. For example, managing ordered data dependencies, inter-domain communication, shared infrastructure, and incoherent workflows.

Testing 245
article thumbnail

Buy Your Embedded Analytics and Empower Your End-Users With the Right Data

Jet Global

Application teams that embed dashboards and reports drive revenue, reduce customer churn, and differentiate their software from the competition. While embedded dashboards create real value, they can also come with real costs. The challenge is collecting all that data into one place and making it understandable.

article thumbnail

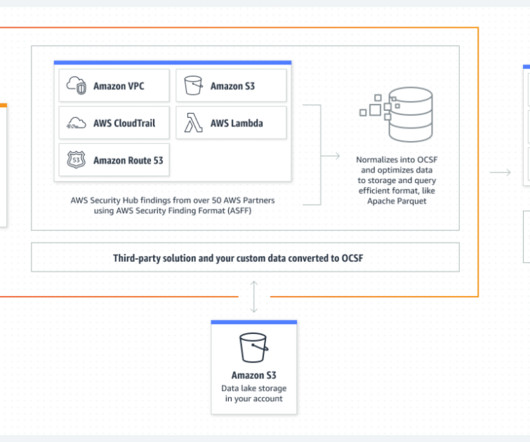
Ingest, transform, and deliver events published by Amazon Security Lake to Amazon OpenSearch Service

AWS Big Data

For more information about enabling Security Lake in your accounts, review Getting started. The sample solution relies on access to a public S3 bucket hosted for this blog so egress rules and permissions modifications may be required if you use S3 endpoints. In OpenSearch Dashboards, choose Security in the navigation pane.