Remove Dashboards Remove Data Integration Remove Presentation Remove Snapshot
article thumbnail

Financial Dashboard: Definition, Examples, and How-tos

FineReport

In today’s dynamic business environment, gaining comprehensive visibility into financial data is crucial for making informed decisions. This is where the significance of a financial dashboard shines through. What is A Financial Dashboard? You can download FineReport for free and have a try! Free Download of FineReport 1.

article thumbnail

End-to-end development lifecycle for data engineers to build a data integration pipeline using AWS Glue

AWS Big Data

Many AWS customers have integrated their data across multiple data sources using AWS Glue , a serverless data integration service, in order to make data-driven business decisions. Are there recommended approaches to provisioning components for data integration?

Insiders

Sign Up for our Newsletter

This site is protected by reCAPTCHA and the Google Privacy Policy and Terms of Service apply.

Trending Sources

article thumbnail

What is a KPI Report? Definition, Examples, and How-tos

FineReport

Typically displayed as an interactive dashboard, this type of report visually presents information related to a predetermined set of key performance indicators. An effectively crafted KPI report, featuring a well-structured dashboard, offers invaluable insights presented in a user-friendly manner, ensuring comprehensibility for all.

KPI 52
article thumbnail

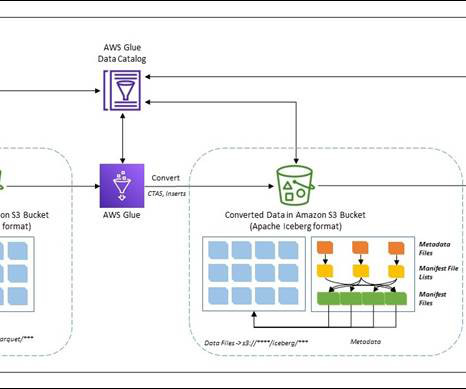
Migrate an existing data lake to a transactional data lake using Apache Iceberg

AWS Big Data

Over the years, data lakes on Amazon Simple Storage Service (Amazon S3) have become the default repository for enterprise data and are a common choice for a large set of users who query data for a variety of analytics and machine leaning use cases. Analytics use cases on data lakes are always evolving.

Data Lake 102
article thumbnail

Patterns for updating Amazon OpenSearch Service index settings and mappings

AWS Big Data

All operations and procedures that we cover in this post are issued directly to the OpenSearch REST API or via the Dev Tools in OpenSearch Dashboards. Note that the patterns and procedures presented in this post have been validated on Amazon OpenSearch Service version 1.3. See the following API command: POST _reindex?

article thumbnail

How Tricentis unlocks insights across the software development lifecycle at speed and scale using Amazon Redshift

AWS Big Data

Additionally, the scale is significant because the multi-tenant data sources provide a continuous stream of testing activity, and our users require quick data refreshes as well as historical context for up to a decade due to compliance and regulatory demands. Finally, data integrity is of paramount importance.

article thumbnail

Dimensional modeling in Amazon Redshift

AWS Big Data

Lastly, we use Amazon QuickSight to gain insights on the modeled data in the form of a QuickSight dashboard. Data can either be loaded when there is a new sale, or daily; this is where the inserted date or load date comes in handy. We use our data mart to visually present the facts in the form of a dashboard.