Remove Dashboards Remove Data Processing Remove Structured Data Remove Visualization
article thumbnail

Introduction To The Basic Business Intelligence Concepts

datapine

Business intelligence concepts refer to the usage of digital computing technologies in the form of data warehouses, analytics and visualization with the aim of identifying and analyzing essential business-based data to generate new, actionable corporate insights. They enable powerful data visualization.

article thumbnail

5 Pain Points of Moving Data to the Cloud and Strategies for Success

Alation

We have seen the COVID-19 pandemic accelerate the timetable of cloud data migration , as companies evolve from the traditional data warehouse to a data cloud, which can host a cloud computing environment. Accompanying this acceleration is the increasing complexity of data. Complex data management is on the rise.

Insiders

Sign Up for our Newsletter

This site is protected by reCAPTCHA and the Google Privacy Policy and Terms of Service apply.

article thumbnail

From Data Silos to Data Fabric with Knowledge Graphs

Ontotext

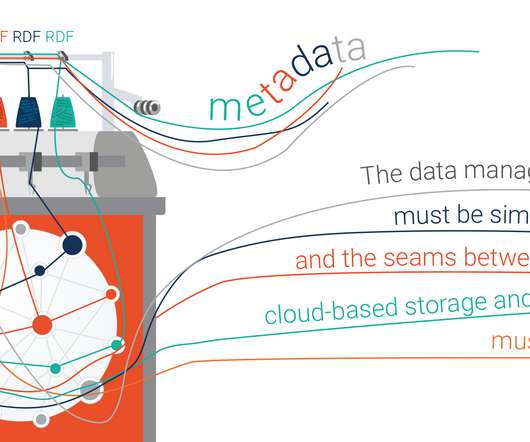
Connecting the data in a graph allows concepts and entities to complement each other’s description. Given a critical mass of domain knowledge and good level of connectivity, KG can serve as context that helps computers comprehend and manipulate data. Make it easy to maintain and evolve your data fabric.

article thumbnail

Seize The Power Of Analytical Reports – Business Examples & Templates

datapine

Use digital dashboards: When considering the question “what is an analytical report,” it’s important to think about the best medium in terms of usability and presentation. It is possible to structure data across a broad range of spreadsheets, but the final result can be more confusing than productive.

Reporting 245
article thumbnail

Create an end-to-end data strategy for Customer 360 on AWS

AWS Big Data

You can use the same capabilities to serve financial reporting, measure operational performance, or even monetize data assets. Strategize based on how your teams explore data, run analyses, wrangle data for downstream requirements, and visualize data at different levels.

article thumbnail

Build a data storytelling application with Amazon Redshift Serverless and Toucan

AWS Big Data

Business intelligence (BI) with dashboards, reports, and analytics remains one of the most popular use cases for data and analytics. It provides business analysts and managers with a visualization of the business’s past and current state, helping leaders make strategic decisions that dictate the future.

article thumbnail

The new challenges of scale: What it takes to go from PB to EB data scale

CIO Business Intelligence

Admittedly, it’s still pretty difficult to visualize this difference. Consider data types. How is it possible to manage the data lifecycle, especially for extremely large volumes of unstructured data? Here is how Cloudera visualizes and controls the data lifecycle. Let’s take it to space.