Remove Dashboards Remove Data Quality Remove Statistics Remove Visualization
article thumbnail

Visualize data quality scores and metrics generated by AWS Glue Data Quality

AWS Big Data

AWS Glue Data Quality allows you to measure and monitor the quality of data in your data repositories. It’s important for business users to be able to see quality scores and metrics to make confident business decisions and debug data quality issues. An AWS Glue crawler crawls the results.

article thumbnail

The Ultimate Guide to Modern Data Quality Management (DQM) For An Effective Data Quality Control Driven by The Right Metrics

datapine

1) What Is Data Quality Management? 4) Data Quality Best Practices. 5) How Do You Measure Data Quality? 6) Data Quality Metrics Examples. 7) Data Quality Control: Use Case. 8) The Consequences Of Bad Data Quality. 9) 3 Sources Of Low-Quality Data.

Insiders

Sign Up for our Newsletter

This site is protected by reCAPTCHA and the Google Privacy Policy and Terms of Service apply.

article thumbnail

Your Data Won’t Speak Unless You Ask It The Right Data Analysis Questions

datapine

This can include a multitude of processes, like data profiling, data quality management, or data cleaning, but we will focus on tips and questions to ask when analyzing data to gain the most cost-effective solution for an effective business strategy. If nothing can be changed, there is no point of analyzing data.

IT 317
article thumbnail

6 DataOps Best Practices to Increase Your Data Analytics Output AND Your Data Quality

Octopai

DataOps is an approach to best practices for data management that increases the quantity of data analytics products a data team can develop and deploy in a given time while drastically improving the level of data quality. Continuous pipeline monitoring with SPC (statistical process control). Results (i.e.

article thumbnail

Top Data Science Tools That Will Empower Your Data Exploration Processes

datapine

Data science has become an extremely rewarding career choice for people interested in extracting, manipulating, and generating insights out of large volumes of data. To fully leverage the power of data science, scientists often need to obtain skills in databases, statistical programming tools, and data visualizations.

article thumbnail

DataOps Observability: Taming the Chaos (Part 3)

DataKitchen

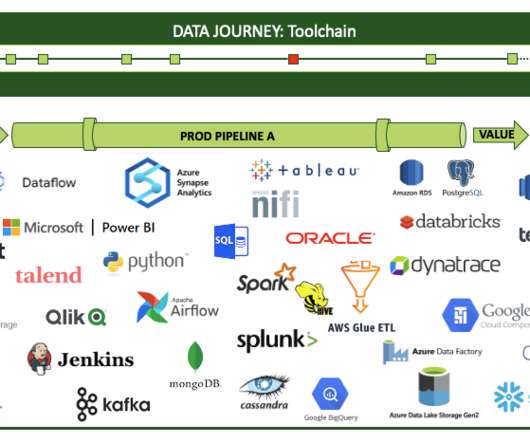
As he thinks through the various journeys that data take in his company, Jason sees that his dashboard idea would require extracting or testing for events along the way. So, the only way for a data journey to truly observe what’s happening is to get his tools and pipelines to auto-report events. Data and tool tests.

Testing 130
article thumbnail

The top 15 big data and data analytics certifications

CIO Business Intelligence

Candidates are required to complete a minimum of 12 credits, including four required courses: Algorithms for Data Science, Probability and Statistics for Data Science, Machine Learning for Data Science, and Exploratory Data Analysis and Visualization. Candidates have 90 minutes to complete the exam.

Big Data 126