Remove Dashboards Remove Informatics Remove Reporting Remove Visualization
article thumbnail

Reporting System: Everything You Need to Know

FineReport

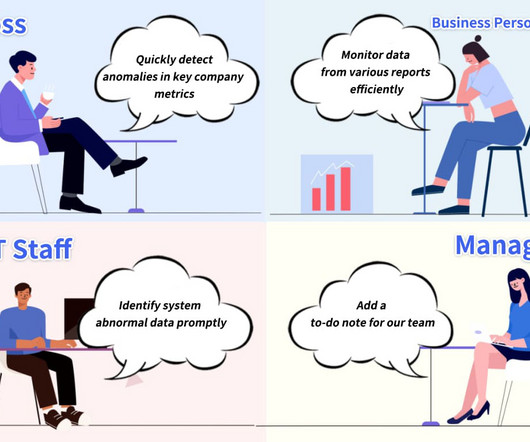
When mentioning the reporting, folders loaded with spreadsheets, graphs, and commentaries may ring a bell. With the development of enterprise informatization, there are more and more kinds of data produced, and the demand for reports surges day by day. What is the Reporting System? Software to Build Reporting System.

article thumbnail

Daily Sales Report: Definition, Samples, Key Elements, and How-tos

FineReport

One of the tools used to achieve this is a daily sales report, which provides an overview of daily sales activities. What is a Daily Sales Report? A daily sales report is a reporting document that provides an overview of a company’s sales performance over a specified period, usually one day.

Sales 52
Insiders

Sign Up for our Newsletter

This site is protected by reCAPTCHA and the Google Privacy Policy and Terms of Service apply.

article thumbnail

Achieve Flexible Monitoring and Notification with our Data Alert?

FineReport

With the increasing number of reports and indicators, frequent access to key data and dashboards continues to escalate users’ time costs. but also support visual configuration via third-party application APIs. This reduces the cost of users repeatedly viewing reports and manually checking data.

article thumbnail

The 9 most in-demand IT jobs in healthcare

CIO Business Intelligence

Informatics is a top priority, driving a demand for skills such as SQL, Python, data analysis, project management, process improvement, and more. The average salary for a healthcare software engineer is $104,181 per year, with a reported salary range from $72,000 to $169,000 per year, according to data from Glassdoor. Data analyst.

article thumbnail

Free Daily Report Template, Help you dramatically Streamline Your Reporting Process

FineReport

Are you anxious about making daily reports? Daily reports are a crucial tool for many businesses to track their daily operations and ensure smooth workflow. However, the process of manually creating daily reports can be tedious and time-consuming, especially for companies that require daily, weekly, or monthly reports.

article thumbnail

Business Intelligence System: Definition, Application & Practice

FineReport

Data Visualization. Data visualization can reflect business operations intuitively. DASHBOARD REPORTING (by FineReport). The reports and dashboard examples in this article are all built-in templates made by FineReport. In this occasion, BI can solve many things that cannot be solved by manual reports.

article thumbnail

Top 10 Key Features of BI Tools in 2020

FineReport

They prefer self-service development, interactive dashboards, and self-service data exploration. On the one hand, governments, Internet companies, and large enterprises attach great importance to informatization construction and require separate maintenance. Analytics dashboards. Interactive visual exploration.