Remove Dashboards Remove Information Remove Interactive Remove Slice and Dice
article thumbnail

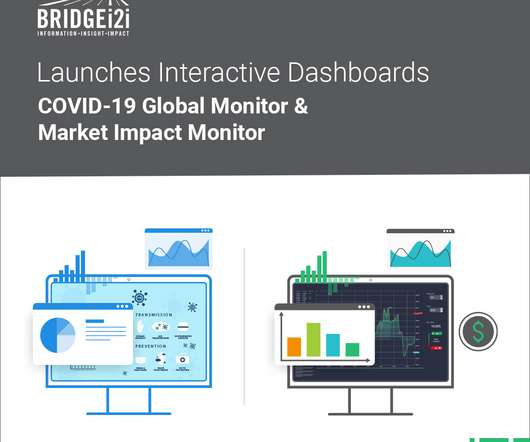
BRIDGEi2i launches two interactive dashboards: COVID19 Global Monitor & COVID Stock Market Impact Monitor

bridgei2i

BRIDGEi2i, a leading AI consultancy, has launched two interactive dashboards that highlight the impact of COVID19 globally across businesses and communities. The Global COVID-19 Monitor gives live insights on the spread of the pandemic across the world and allows you to slice and dice data from many perspectives.

article thumbnail

Enhance your analytics embedding experience with the new Amazon QuickSight JavaScript SDK

AWS Big Data

Amazon QuickSight is a fully managed, cloud-native business intelligence (BI) service that makes it easy to connect to your data, create interactive dashboards and reports, and share these with tens of thousands of users, either within QuickSight or embedded in your application or website. Additionally, SDK v2.0

Insiders

Sign Up for our Newsletter

This site is protected by reCAPTCHA and the Google Privacy Policy and Terms of Service apply.

article thumbnail

Business Intelligence for Marketing: Offer Efficient Work

FineReport

BI tools will offer all the needed data to provide useful information and help assess and prepare marketing for marketing teams. Through intuitive dashboard , marketing team could adjust from the reality and make up customer-based sales strategies. Besides forming reporting, FineReport uses dashboard to aid the company’s operation.

article thumbnail

Common Business Intelligence Challenges Facing Entrepreneurs

datapine

In the Age of Information, forward-thinking organizations are reaching exciting new levels by leveraging the capabilities of innovative new business intelligence (BI) solutions. They need to make quick and informed decisions. Ineffective dashboards can be easily updated to focus on business needs.

article thumbnail

Documenting and Managing Governance, Risk and Compliance with Business Process

erwin

BP modeling and analysis shows process flows, system interactions and organizational hierarchies to identity areas for improvement as well as practices susceptible to the greatest security, compliance or other risks so controls and audits can be implemented to mitigate exposures. All of these items would comprise the GRC layer.

Risk 98
article thumbnail

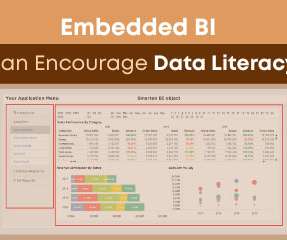
Do I Need Both BI Tools and Augmented Analytics?

Smarten

Your senior execs and managers want to leverage data and information to gain a competitive advantage and succeed. Social BI Tools that allow for sharing of data, alerts, dashboards and interactivity to support decisions, enable online communication and collaboration. Dashboards. Business Intelligence. Cross-Tab Reporting.

article thumbnail

Accounting and Finance Pros Can Use Tally ERP Analytics!

Smarten

and analyzing this information to gain significant insights, predict future outcomes, or even ascertain risk.’. Various interactive reports with drill-down to slice and dice data by vendor, product, service, cost, sales person, location, customer, inventory, purchasing, costs, etc.

Finance 52