Remove Dashboards Remove Key Performance Indicator Remove Risk Remove Visualization
article thumbnail

What is Data Visualization: Complete Guide 2024

FineReport

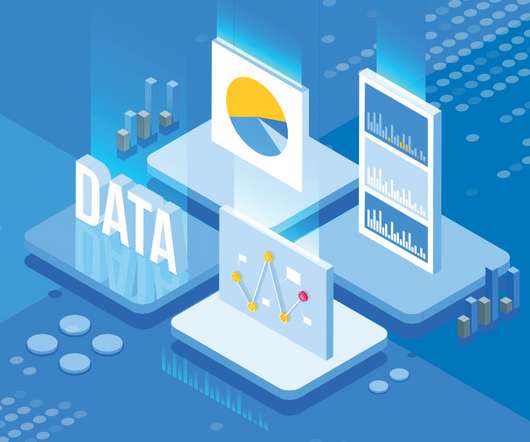
What is Data Visualization Understanding the Concept Data visualization, in simple terms, refers to the presentation of data in a visual format. By utilizing visual elements, data visualization allows individuals to grasp difficult concepts or identify new patterns within the data.

article thumbnail

Get Started With Business Performance Dashboards – Examples & Templates

datapine

That said, if you’re looking to evolve your empire, increase brand awareness, and boost your bottom line, embracing business performance dashboards and big data should be at the top of your priority list. Exclusive Bonus Content: Stay on top of your business performance! The Link Between Data And Business Performance.

Insiders

Sign Up for our Newsletter

This site is protected by reCAPTCHA and the Google Privacy Policy and Terms of Service apply.

Trending Sources

article thumbnail

Everything You Need to Know About Project Management Dashboard

FineReport

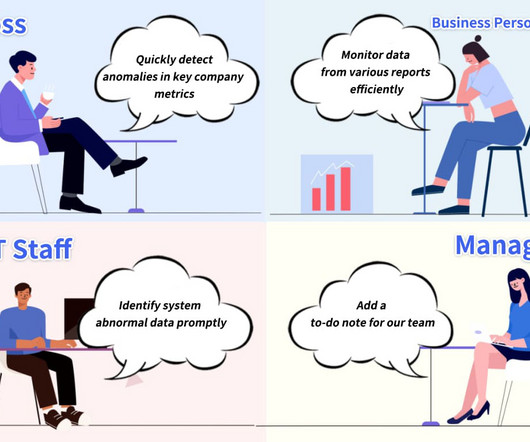
Thus, one tool that has gained significant popularity in recent years is the Project Management Dashboard. Moreover, the implementation of an effective Project Management Dashboard facilitates data-driven decision-making and sustainable business success. What Is A Project Management Dashboard?

article thumbnail

Financial Dashboard: Definition, Examples, and How-tos

FineReport

This is where the significance of a financial dashboard shines through. In this article, we will explore the concept of a financial dashboard, highlight its numerous benefits, and provide various kinds of financial dashboard examples for you to employ and explore. What is A Financial Dashboard?

article thumbnail

HR Dashboard: Everything You Need To Know

FineReport

An HR dashboard functions as an advanced analytics tool that utilizes interactive data visualizations to present crucial HR metrics. Its primary objective is to enhance the HR department’s recruitment processes, optimize workplace management, and improve overall employee performance. What is an HR Dashboard?

article thumbnail

How To Make Stunning Dashboards & Take Your Decision Making To The Next Level

datapine

If you want to convey crucial information to decision-makers in the easiest and most effective way possible, you need to embrace the power of interactive dashboards. A business dashboard offers at-a-glance insights based on key performance indicators (KPIs) and is an intuitive and visually pleasing way to consume data.

article thumbnail

Top 15 Warehouse KPIs & Metrics For Efficient Management 

datapine

3) Top 15 Warehouse KPIs Examples 4) Warehouse KPI Dashboard Template The use of big data and analytics technologies has become increasingly popular across industries. Every day, more and more businesses realize the value of analyzing their own performance to boost strategies and achieve their goals. Why Do You Need Warehouse KPIs?

Metrics 217