Remove Dashboards Remove Measurement Remove Metrics Remove White Paper
article thumbnail

Building the Ultimate Sales Dashboard

Jet Global

This is where sales dashboards have proven to be highly effective. In sales, dashboards play a huge role in managing day-to-day operations, measuring performance, and adapting quickly to changing conditions. To set you up for success in analytics, we have created a quick guide on how to create the ultimate sales dashboard.

Sales 74
article thumbnail

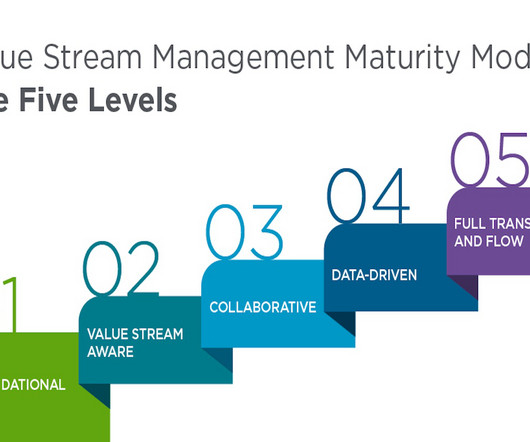
Value Stream Management for digital transformation: A new maturity model

CIO Business Intelligence

Teams have also started working to collect more data for measuring customer value, which is a vital foundation for tracking progress. However, at this phase, groups aren’t fully harnessing these metrics to guide holistic process improvements. Pilot initiatives have been initiated, and new approaches are being tested and evaluated.

Insiders

Sign Up for our Newsletter

This site is protected by reCAPTCHA and the Google Privacy Policy and Terms of Service apply.

Trending Sources

article thumbnail

Building the Ultimate Sales Dashboard

Jet Global

This is where sales dashboards have proven to be highly effective. In sales, dashboards play a huge role in managing day-to-day operations, measuring performance, and adapting quickly to changing conditions. To set you up for success in analytics, we have created a quick guide on how to create the ultimate sales dashboard.
Sales 40
article thumbnail

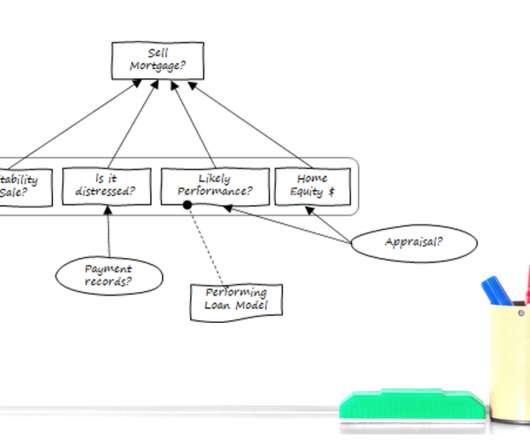
Make Your Investment in Analytic Technology Pay Off With Decision Requirements Modeling

Decision Management Solutions

Like many enterprises, you’ve likely made a hefty investment in analytic technology—from interactive dashboards and advanced visualization tools to data mining, predictive analytics, machine learning (ML), and artificial intelligence (AI). Focusing on decision-making changes everything. We can show you how to accomplish this. Get started.

article thumbnail

Transforming the Future of Learning with Analytics

Sisense

A recent study by Learning Pool revealed 76% of mature metrics practices are enabled by technology that integrates data from multiple sources. Learning Pool’s white paper Measuring the Modern Learner Experience explains how an LRS specifically stores xAPI statements, which at their most basic level combine an actor, a verb, and an object.

article thumbnail

Data Observability and Monitoring with DataOps

DataKitchen

When analytics and dashboards are inaccurate, business leaders may not be able to solve problems and pursue opportunities. Some will argue that observability is nothing more than testing and monitoring applications using tests, metrics, logs, and other artifacts. Week after week, it is measured with a million rows.

Testing 214
article thumbnail

Take Advantage Of The Best Interactive & Effective Data Visualization Examples

datapine

Whether static or interactive dashboards , these creative data visualization examples will serve as an inspiration for any data enthusiast. By utilizing your own dashboard storytelling efforts, you will be able to spot fresh insights and spark new discussions based on the growth, development, and direction of your business.