Remove Dashboards Remove Metrics Remove Risk Management Remove Visualization
article thumbnail

Everything You Need to Know About Project Management Dashboard

FineReport

Thus, one tool that has gained significant popularity in recent years is the Project Management Dashboard. Moreover, the implementation of an effective Project Management Dashboard facilitates data-driven decision-making and sustainable business success. What Is A Project Management Dashboard?

article thumbnail

Insurance Dashboard Design: KPIs, Analytics & Examples

FineReport

Insurance companies provide risk management in the form of insurance contracts. Industry-specific, comprehensive, and reliable data management and presentation have become an issue of increasing concern in the insurance industry. The insurance dashboard is one of the most commonly used data display methods.

Insiders

Sign Up for our Newsletter

This site is protected by reCAPTCHA and the Google Privacy Policy and Terms of Service apply.

article thumbnail

Best BI Tools Examples for 2024: Business Intelligence Software

FineReport

Through interactive dashboards , these tools empower users across various departments to access and interpret data effectively. In addition to these advancements, another prominent trend in data analysis is the growing impact of data visualization. When comparing leading BI tools, it is crucial to assess these aspects thoroughly.

article thumbnail

SANS Institute uses Amazon QuickSight to drive transformational security awareness maturity within organizations

AWS Big Data

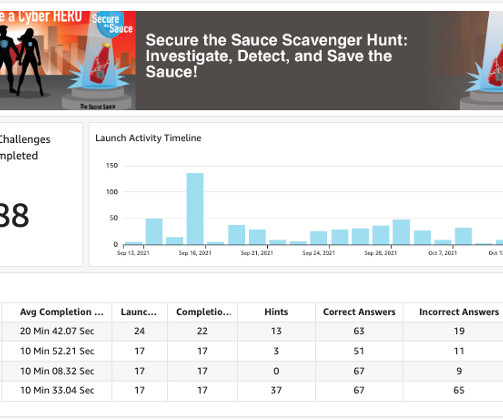
We identified Amazon QuickSight , a fully managed, cloud-native business intelligence (BI) service, as the product that fit all our criteria. With it, we found an intuitive product with rich visualizations that we could build and grow with rapidly, allowing us to innovate without monetary risks or being locked in to cumbersome contracts.

article thumbnail

A Guide To Starting A Career In Business Intelligence & The BI Skills You Need

datapine

To simplify things, you can think of back-end BI skills as more technical in nature and related to building BI platforms, like online data visualization tools. For example, you could be the one to extract actionable insights from specific retail KPIs that need to be visualized and presented during a meeting. BI developer.

article thumbnail

Beyond Building Reports — Infusing Analytics into Applications with DNV

Sisense

In this article, we’ll look at how DNV took intelligence from its massive datasets and put the right bits of information into its platforms in the right way (not simply embedding reports and dashboards) to drive impact for its users. DNV is an independent expert in risk management and assurance, operating in more than 100 countries.

article thumbnail

Project Management Report: Structure, Examples & Free Templates

FineReport

Risk management. Here, project managers should summarize all predicted risks so that stakeholders can obtain a clear risk assessment and prepare plan B. Project Dashboard. A project dashboard offers a high-level view of the critical data about your project’s current status. Free Download.