Remove Dashboards Remove Metrics Remove Snapshot Remove Statistics
article thumbnail

Get Started With Business Performance Dashboards – Examples & Templates

datapine

That said, if you’re looking to evolve your empire, increase brand awareness, and boost your bottom line, embracing business performance dashboards and big data should be at the top of your priority list. You need data-driven decisions, and a dashboard for business performance will make sure you reap the best possible rewards.

article thumbnail

Real-time cost savings for Amazon Managed Service for Apache Flink

AWS Big Data

Managed Service for Apache Flink manages the underlying infrastructure and Apache Flink components that provide durable application state, metrics, logs, and more. The third cost component is durable application backups, or snapshots. The cost of durable application backup (snapshots) is $0.023 per GB per month.

Insiders

Sign Up for our Newsletter

This site is protected by reCAPTCHA and the Google Privacy Policy and Terms of Service apply.

article thumbnail

Your Ultimate Guide To Modern KPI Reports In The Digital Age – Examples & Templates

datapine

Typically presented in the form of an interactive dashboard , this kind of report provides a visual representation of the data associated with your predetermined set of key performance indicators – or KPI data, for short. Set up a report which you can visualize with an online dashboard. Consider your data sources. 2) Select your KPIs.

KPI 223
article thumbnail

Your Definitive Guide To Building Valuable Narratives Through Data Storytelling

datapine

Stories inspire, engage, and have the unique ability to transform statistical information into a compelling narrative that can significantly enhance business success. a) Turn metrics into actionable concepts. As we’ve explored, knowing how to tell a story with data will empower you to turn metrics into actionable concepts or insights.

KPI 193
article thumbnail

Achieve near real time operational analytics using Amazon Aurora PostgreSQL zero-ETL integration with Amazon Redshift

AWS Big Data

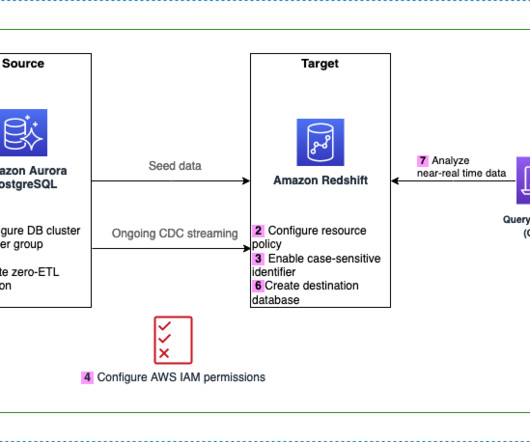
xlplus) with at least two nodes, or Redshift Serverless Encrypted (if using a provisioned cluster) For this post, we create and configure a Redshift Serverless workgroup and namespace as the target data warehouse, following these steps: On the Amazon Redshift console, choose Serverless dashboard in the navigation pane.

article thumbnail

Unlock insights on Amazon RDS for MySQL data with zero-ETL integration to Amazon Redshift

AWS Big Data

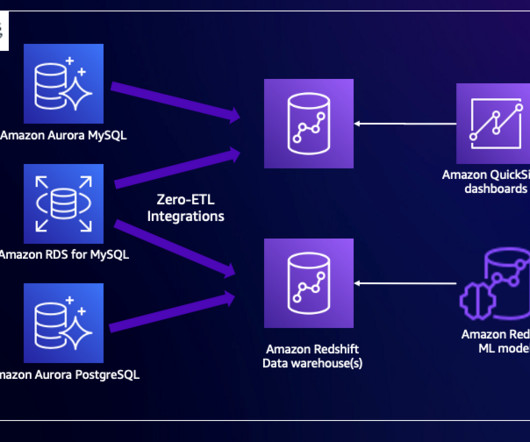
You can continue with your transaction processing on Amazon RDS or Amazon Aurora while simultaneously using Amazon Redshift for analytics workloads such as reporting and dashboards. They would like to get these metrics in near real time using a zero-ETL integration. The following diagram illustrates this architecture.

article thumbnail

Getting started guide for near-real time operational analytics using Amazon Aurora zero-ETL integration with Amazon Redshift

AWS Big Data

You can perform real-time transaction processing on data in Aurora while simultaneously using Amazon Redshift for analytics workloads such as reporting and dashboards. The company’s business analysts want to generate metrics to identify ticket movement over time, success rates for sellers, and the best-selling events, venues, and seasons.