Remove Dashboards Remove OLAP Remove Technology Remove Visualization
article thumbnail

What are decision support systems? Sifting data for better business decisions

CIO Business Intelligence

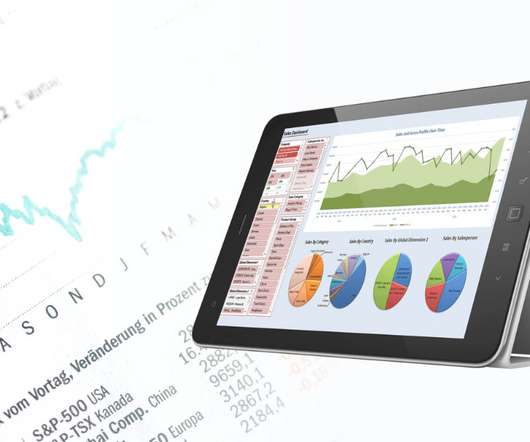
The concept of DSS grew out of research conducted at the Carnegie Institute of Technology in the 1950s and 1960s, but really took root in the enterprise in the 1980s in the form of executive information systems (EIS), group decision support systems (GDSS), and organizational decision support systems (ODSS). ERP dashboards.

article thumbnail

Reporting Analytics vs. Financial Reporting: Is There a Difference?

Jet Global

Multi-dimensional analysis is sometimes referred to as “OLAP”, which stands for “online analytical processing.” Technically speaking, OLAP refers to methodologies for producing multidimensional analysis on high-volume data sets.). That may prompt further investigation and could reveal insights as to the appropriate corrective action.

Insiders

Sign Up for our Newsletter

This site is protected by reCAPTCHA and the Google Privacy Policy and Terms of Service apply.

Trending Sources

article thumbnail

Navigating Data Entities, BYOD, and Data Lakes in Microsoft Dynamics

Jet Global

Online analytical processing (OLAP), which enabled users to quickly and easily view data along different dimensions, was coming of age. The challenge with OLAP, however, is that it requires intensive processing power to aggregate data according to various categories or dimensions. Data warehouses have been in widespread use for years.

article thumbnail

A Complete Guide For BI Reporting

FineReport

It is a part of BI features that allow you to extract and dynamically display data in the form of different types of visualizations such as charts and tables, so users can transform data into useful information and discover insights. . Finally, the data visualization types in Excel are very few compared to bi reporting tools.

article thumbnail

Enterprise Reporting: The 2020’s Comprehensive Guide

FineReport

It uses enterprise reporting tools to organize data into charts, tables, widgets, or other visualizations. The central one is the data visualization technology at the display level. And enterprise reporting is the primary data visualization technology in most enterprises. . FineReport Architecture. From FineReport.

article thumbnail

The Future of AI in the Enterprise

Jet Global

While the technology behind enabling computers to simulate human thought has been developing, at times slowly, over the past half-century, the cost of implementation, readily available access to cloud computing, and practical business use cases are primed to help AI make a dramatic impact in the enterprise over the next few years.

article thumbnail

AI vs. BI for Business, What Do You Need?

Jet Global

With all the attention being paid to artificial intelligence (AI) these days, it’s no surprise that enterprise leaders are scrambling to find ways to shoehorn AI implementations into their technology stack. What are some of the core components of business intelligence?