Remove Dashboards Remove Optimization Remove Uncertainty Remove Visualization
article thumbnail

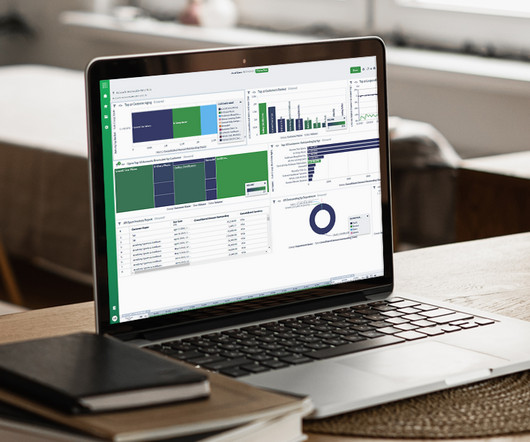
iostudio delivers key metrics to public sector recruiters with Amazon QuickSight

AWS Big Data

We wanted to include interactive, real-time visualizations to support recruiters from one of our government clients. Our previous solution offered visualization of key metrics, but point-in-time snapshots produced only in PDF format. We can pick what we need, and use what we need with pay-as-you-go pricing.

Metrics 96
article thumbnail

What are decision support systems? Sifting data for better business decisions

CIO Business Intelligence

A DSS supports the management, operations, and planning levels of an organization in making better decisions by assessing the significance of uncertainties and the tradeoffs involved in making one decision over another. ERP dashboards. Optimization analysis models. Clinical DSS. Model-driven DSS. Sensitivity analysis models.

Insiders

Sign Up for our Newsletter

This site is protected by reCAPTCHA and the Google Privacy Policy and Terms of Service apply.

article thumbnail

The Art and Science of FP&A Storytelling

Timo Elliott

With advanced analytics, flexible dashboarding and effective data visualization, FP&A storytelling has become both an art and science. Dashboards and analytics have been around for a long, long time. First, because uncertainty exploded. Real-world storytelling dashboard examples. What typically goes wrong?

article thumbnail

insightsoftware Launches Angles Professional for Oracle to Automate Recurring Operational Reports at the Gartner Data & Analytics Summit 2023

Jet Global

Recognizing a need for better operational analytics, insightsoftware leveraged award-winning technology from Logi Analytics to provide Oracle ERP Cloud users the ability to customize, create, and share interactive dashboards and reports across all departments of a business.

article thumbnail

3 reasons why business and data analysts need to work with real-time events

IBM Big Data Hub

Uncertainty is expected and complexity is compounding. To meet these objectives, business and data professionals need to go beyond cookie-cutter business intelligence, data visualization dashboards and data analytics tools. As threats materialize on multiple fronts, organizations must reduce the time from insight to action.”

article thumbnail

How Microsoft is Reactivating its Workforce During The Pandemic

Timo Elliott

And we started creating dashboards of the situation within each location around the world, and we got into a regular rhythm of triaging the situation and figuring out what we needed to do along the way. As you know, we have a strong set of capabilities around Power BI to be able to create dashboards.

IT 71
article thumbnail

Bridging the Gap: How ‘Data in Place’ and ‘Data in Use’ Define Complete Data Observability

DataKitchen

The uncertainty of not knowing where data issues will crop up next and the tiresome game of ‘who’s to blame’ when pinpointing the failure. Given this, it’s crucial to have in Place meticulous testing protocols for the results of models, visualizations, data delivery mechanisms, and overall data utilization.

Testing 176