Remove Data-driven Remove Metrics Remove Statistics Remove Uncertainty
article thumbnail

Three Emerging Analytics Products Derived from Value-driven Data Innovation and Insights Discovery in the Enterprise

Rocket-Powered Data Science

I recently saw an informal online survey that asked users which types of data (tabular, text, images, or “other”) are being used in their organization’s analytics applications. This was not a scientific or statistically robust survey, so the results are not necessarily reliable, but they are interesting and provocative.

article thumbnail

What you need to know about product management for AI

O'Reilly on Data

AI products are automated systems that collect and learn from data to make user-facing decisions. All you need to know for now is that machine learning uses statistical techniques to give computer systems the ability to “learn” by being trained on existing data. Machine learning adds uncertainty.

Insiders

Sign Up for our Newsletter

This site is protected by reCAPTCHA and the Google Privacy Policy and Terms of Service apply.

article thumbnail

Uncertainties: Statistical, Representational, Interventional

The Unofficial Google Data Science Blog

by AMIR NAJMI & MUKUND SUNDARARAJAN Data science is about decision making under uncertainty. Some of that uncertainty is the result of statistical inference, i.e., using a finite sample of observations for estimation. But there are other kinds of uncertainty, at least as important, that are not statistical in nature.

article thumbnail

The Lean Analytics Cycle: Metrics > Hypothesis > Experiment > Act

Occam's Razor

To win in business you need to follow this process: Metrics > Hypothesis > Experiment > Act. We are far too enamored with data collection and reporting the standard metrics we love because others love them because someone else said they were nice so many years ago. That metric is tied to a KPI.

Metrics 156
article thumbnail

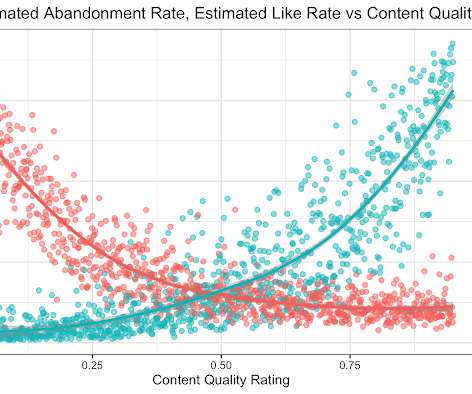
Towards optimal experimentation in online systems

The Unofficial Google Data Science Blog

the weight given to Likes in our video recommendation algorithm) while $Y$ is a vector of outcome measures such as different metrics of user experience (e.g., Crucially, it takes into account the uncertainty inherent in our experiments. Here, $X$ is a vector of tuning parameters that control the system's operating characteristics (e.g.

article thumbnail

How Microsoft is Reactivating its Workforce During The Pandemic

Timo Elliott

And so we scrambled the crisis management team and started looking at the data from very, very early on. It’s very fact-driven, but it’s a combination of facts and how we’re responding as a company and how people are responding personally. And it’s very, very data-driven. It’s a feedback loop.

IT 76
article thumbnail

Humans-in-the-loop forecasting: integrating data science and business planning

The Unofficial Google Data Science Blog

by THOMAS OLAVSON Thomas leads a team at Google called "Operations Data Science" that helps Google scale its infrastructure capacity optimally. But looking through the blogosphere, some go further and posit that “platformization” of forecasting and “forecasting as a service” can turn anyone into a data scientist at the push of a button.