article thumbnail

Amazon OpenSearch Service Under the Hood : OpenSearch Optimized Instances(OR1)

AWS Big Data

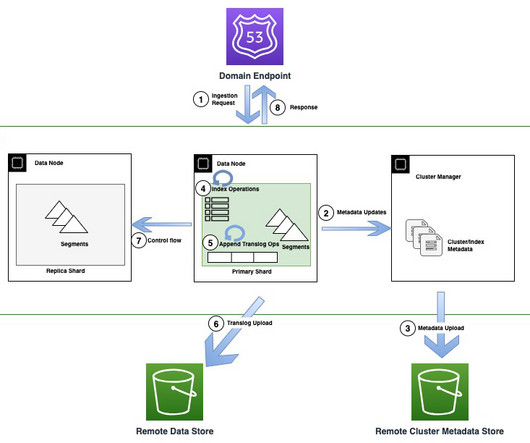
With this new instance family, OpenSearch Service uses OpenSearch innovation and AWS technologies to reimagine how data is indexed and stored in the cloud. Today, customers widely use OpenSearch Service for operational analytics because of its ability to ingest high volumes of data while also providing rich and interactive analytics.

article thumbnail

Your Definitive Guide To Building Valuable Narratives Through Data Storytelling

datapine

By gaining centralized access to business data and presenting it in a visual way that follows a logical path and provides invaluable insights on a particular area or subject, you stand to set yourself apart from your competitors and become a leader in your field. Exclusive Bonus Content: Your definitive guide to data storytelling!

KPI 193
Insiders

Sign Up for our Newsletter

This site is protected by reCAPTCHA and the Google Privacy Policy and Terms of Service apply.

Trending Sources

article thumbnail

Top 10 Management Reporting Best Practices To Create Effective Reports

datapine

Management reporting is a source of business intelligence that helps business leaders make more accurate, data-driven decisions. But, these reports are only as useful as the work that goes into preparing and presenting them. They were using historical data only. They’re also slow.

Reporting 263
article thumbnail

10 Examples of How Big Data in Logistics Can Transform The Supply Chain

datapine

Table of Contents 1) Benefits Of Big Data In Logistics 2) 10 Big Data In Logistics Use Cases Big data is revolutionizing many fields of business, and logistics analytics is no exception. The complex and ever-evolving nature of logistics makes it an essential use case for big data applications. Did you know?

Big Data 275
article thumbnail

Best Dashboard Ideas & Design Examples To Boost Your Business Success

datapine

The ability to monitor, visualize, and analyze relevant data gives today’s businesses, across a host of sectors, the power to understand their prospects, make informed decisions, increase efficiencies, and work towards a set of rewarding long term goals. The Value Of Different Dashboard Ideas & Designs. 1) Marketing KPI Dashboard.

article thumbnail

Take Advantage Of The Top 16 Sales Graphs And Charts To Boost Your Business

datapine

From sales performance and targets through to customer acquisition costs, sales cycle, and beyond — here, we’ll present sales graphs and charts that matter to the ongoing growth of your business, in turn considering the essential question, what type of charts are used for sales? How Do You Know Which Graph To Use? 1) Sales Performance.

Sales 235
article thumbnail

What is Reporting? Meaning & Examples

FineReport

Reports use tables, charts, and other widgets to display data. Reporting can also be understood as the process of presenting the results of a series of research and analysis. Simply put, you can understand the report as a snapshot of the actual situation, and the analysis can be described as the further exploration of the phenomenon.