Remove Data Processing Remove Interactive Remove Structured Data Remove Visualization
article thumbnail

Introduction To The Basic Business Intelligence Concepts

datapine

Business intelligence concepts refer to the usage of digital computing technologies in the form of data warehouses, analytics and visualization with the aim of identifying and analyzing essential business-based data to generate new, actionable corporate insights. They enable powerful data visualization.

article thumbnail

Big Data Ingestion: Parameters, Challenges, and Best Practices

datapine

Operations data: Data generated from a set of operations such as orders, online transactions, competitor analytics, sales data, point of sales data, pricing data, etc. The gigantic evolution of structured, unstructured, and semi-structured data is referred to as Big data. Self-Service.

Big Data 100
Insiders

Sign Up for our Newsletter

This site is protected by reCAPTCHA and the Google Privacy Policy and Terms of Service apply.

article thumbnail

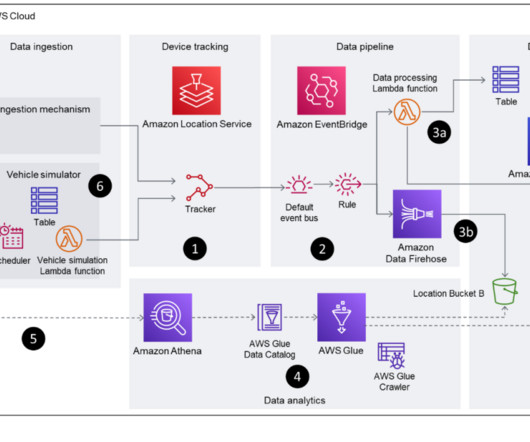
Gain insights from historical location data using Amazon Location Service and AWS analytics services

AWS Big Data

Visual layouts in some screenshots in this post may look different than those on your AWS Management Console. Data generation In this section, we discuss the steps to manually or automatically generate journey data. Refer to the instructions in the README file for steps on how to provision and decommission this solution.

article thumbnail

Seize The Power Of Analytical Reports – Business Examples & Templates

datapine

It is possible to structure data across a broad range of spreadsheets, but the final result can be more confusing than productive. By using an online dashboard , you will be able to gain access to dynamic metrics and data in a way that’s digestible, actionable, and accurate.

Reporting 245
article thumbnail

Create an end-to-end data strategy for Customer 360 on AWS

AWS Big Data

Customer 360 (C360) provides a complete and unified view of a customer’s interactions and behavior across all touchpoints and channels. This view is used to identify patterns and trends in customer behavior, which can inform data-driven decisions to improve business outcomes. Then, you transform this data into a concise format.

article thumbnail

The new challenges of scale: What it takes to go from PB to EB data scale

CIO Business Intelligence

Admittedly, it’s still pretty difficult to visualize this difference. Consider data types. How is it possible to manage the data lifecycle, especially for extremely large volumes of unstructured data? Only 12% of IT decision-makers report that their organizations interact with data across the full analytics lifecycle.

article thumbnail

Build a data storytelling application with Amazon Redshift Serverless and Toucan

AWS Big Data

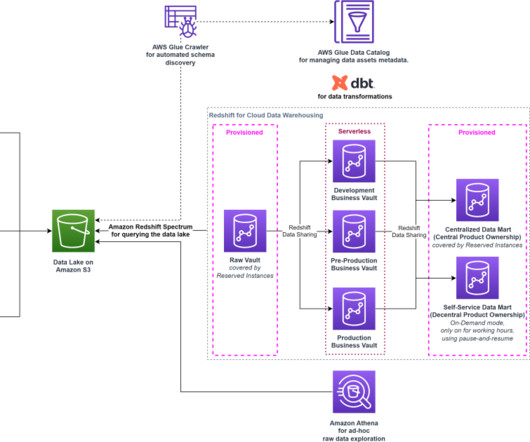
Business intelligence (BI) with dashboards, reports, and analytics remains one of the most popular use cases for data and analytics. It provides business analysts and managers with a visualization of the business’s past and current state, helping leaders make strategic decisions that dictate the future.