article thumbnail

Common Business Intelligence Challenges Facing Entrepreneurs

datapine

Robust dashboards can be easily implemented, allowing potential savings and profits to be quickly highlighted with simple slicing and dicing of the data. It can be easy to roll out a strategic, operational, analytics and tactical dashboard so that each dashboard tells a cohesive and focused data story.

article thumbnail

How OLAP and AI can enable better business

IBM Big Data Hub

Initially, they were designed for handling large volumes of multidimensional data, enabling businesses to perform complex analytical tasks, such as drill-down , roll-up and slice-and-dice. Early OLAP systems were separate, specialized databases with unique data storage structures and query languages.

OLAP 61
Insiders

Sign Up for our Newsletter

This site is protected by reCAPTCHA and the Google Privacy Policy and Terms of Service apply.

article thumbnail

How Newcomp Analytics partners with IBM to advance clients’ supply chain insights

IBM Big Data Hub

Left to their own devices, they had resorted to using legacy reporting tools such as Excel that required manual gathering, slicing and dicing of data. Consequently, this data was siloed, unshareable, hard to use, lacked quality and governance controls, and could not be used in automated processes.

article thumbnail

You Cannot Get to the Moon on a Bike!

Ontotext

This will allow us to perform quicker slicing and dicing and to get richer results in less time. To implement a data fabric pattern, on the other hand, we need data management tools for data integration, data quality, and data governance.

article thumbnail

Measuring Validity and Reliability of Human Ratings

The Unofficial Google Data Science Blog

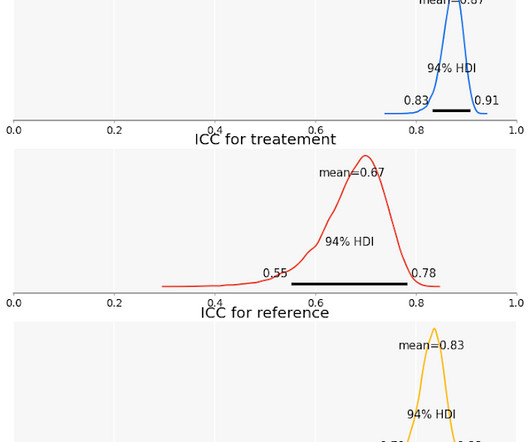
If they roll two dice and apply a label if the dice rolls sum to 12 they will agree 85% of the time, purely by chance. We normally have lots of labelers and items in our dataset, and priors give a form of regularization that better handles cases where data might be sparse and makes the model less prone to overfitting.

article thumbnail

Great Storytelling With Data: Visualize Simply And Focus Obsessively

Occam's Razor

When you are presenting, to an audience of 3 or 3,000, your goal should be to get the data out of the way as fast as you can, so that you can move to the so what conversation. Use these standard data visualization approaches to communicate more effectively to quicker internalization of reality. #9. Look beyond the obvious, really look.