Remove Document Remove Interactive Remove Knowledge Discovery Remove Visualization
article thumbnail

Understanding Social And Collaborative Business Intelligence

datapine

This is done using interactive Business Intelligence and Analytics dashboards along with intuitive tools to improve data clarity. In collaborative business intelligence, the workers and business managers interact with each other in order to improve the communication system. What is Social Business Intelligence? Website Link: [link] .

article thumbnail

GraphDB and metaphactory Part II: An RDF Database and A Knowledge Graph Platform in Action

Ontotext

This post looks at a specific clinical trial scoping example, powered by a knowledge graph that we have built for the EU funded project FROCKG , where both Ontotext and metaphacts are partners. Visual Ontology Modeling With metaphactory. Let’s first have a look at the knowledge graph management capabilities provided by metaphactory.

Insiders

Sign Up for our Newsletter

This site is protected by reCAPTCHA and the Google Privacy Policy and Terms of Service apply.

Trending Sources

article thumbnail

Performing Non-Compartmental Analysis with Julia and Pumas AI

Domino Data Lab

Domino Lab supports both interactive and batch experimentation with all popular IDEs and notebooks (Jupyter, RStudio, SAS, Zeppelin, etc.). We can also plot the observed maximum concentration values and visually inspect the minimum, quartiles, median, and outliers by drug dose. 2] Pumas AI Documentation, [link]. [3]

Metrics 59
article thumbnail

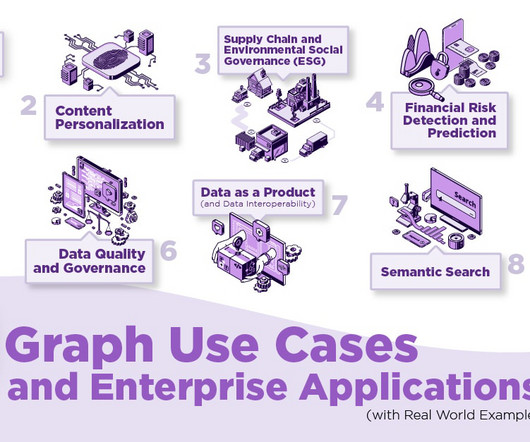
Top Graph Use Cases and Enterprise Applications (with Real World Examples)

Ontotext

Graphs boost knowledge discovery and efficient data-driven analytics to understand a company’s relationship with customers and personalize marketing, products, and services. However, this information is typically stored in disparate locations, often hidden within departmental documents or applications.

article thumbnail

Understanding Social And Collaborative Business Intelligence

datapine

This is done using interactive Business Intelligence and Analytics dashboards along with intuitive tools to improve data clarity. In collaborative business intelligence, the workers and business managers interact with each other in order to improve the communication system. What is Social Business Intelligence? Website Link: [link] .

article thumbnail

Explaining black-box models using attribute importance, PDPs, and LIME

Domino Data Lab

The need for interaction – complex decision making systems often rely on Human–Autonomy Teaming (HAT), where the outcome is produced by joint efforts of one or more humans and one or more autonomous agents. Skater provides a wide range of algorithms that can be used for visual interpretation (e.g. A14 : no checking account.

Modeling 139