article thumbnail

Understanding Social And Collaborative Business Intelligence

datapine

Discovery and documentation serve as key features in collaborative BI. This kind of analysis leads to feedback that can aid in improving the decision-making process, letting companies document the best practices and monitor the data that’s the most useful in this scenario. However, collaborative BI helps in changing that.

article thumbnail

GraphDB and metaphactory Part II: An RDF Database and A Knowledge Graph Platform in Action

Ontotext

This post looks at a specific clinical trial scoping example, powered by a knowledge graph that we have built for the EU funded project FROCKG , where both Ontotext and metaphacts are partners. Visual Ontology Modeling With metaphactory. Let’s first have a look at the knowledge graph management capabilities provided by metaphactory.

Insiders

Sign Up for our Newsletter

This site is protected by reCAPTCHA and the Google Privacy Policy and Terms of Service apply.

article thumbnail

Performing Non-Compartmental Analysis with Julia and Pumas AI

Domino Data Lab

We can now visually inspect the change in plasma concentration over time in the 5, 20, and 80mg profiles: Next, we call the Pumas read_nca function, which creates an NCAPopulation object containing preprocessed data for generation of all NCA values. 2] Pumas AI Documentation, [link]. [3] pain_df.TIME.== 0, pain_df.DOSE, missing).

Metrics 59
article thumbnail

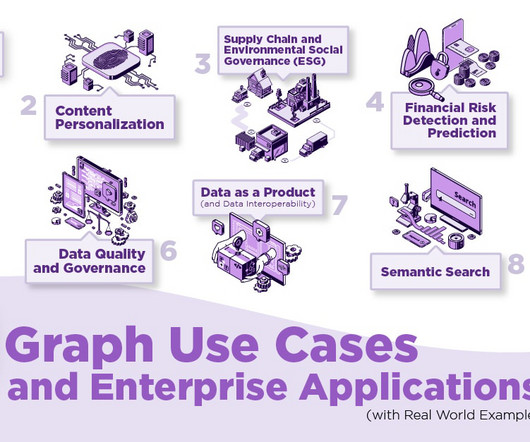
Top Graph Use Cases and Enterprise Applications (with Real World Examples)

Ontotext

Graphs boost knowledge discovery and efficient data-driven analytics to understand a company’s relationship with customers and personalize marketing, products, and services. However, this information is typically stored in disparate locations, often hidden within departmental documents or applications.

article thumbnail

Fundamentals of Data Mining

Data Science 101

Data mining is the process of discovering these patterns among the data and is therefore also known as Knowledge Discovery from Data (KDD). The patterns discovered after this step are interpreted using various visualization and reporting techniques and are made comprehensible for other team members to understand. Deployment.

article thumbnail

Understanding Social And Collaborative Business Intelligence

datapine

Discovery and documentation serve as key features in collaborative BI. This kind of analysis leads to feedback that can aid in improving the decision-making process, letting companies document the best practices and monitor the data that’s the most useful in this scenario. However, collaborative BI helps in changing that.

article thumbnail

Explaining black-box models using attribute importance, PDPs, and LIME

Domino Data Lab

Skater provides a wide range of algorithms that can be used for visual interpretation (e.g. A comprehensive list of all attributes and symbol codes is given in the document that accompanies the original dataset. Courville, Pascal Vincent, Visualizing Higher-Layer Features of a Deep Network, 2009. A14 : no checking account.

Modeling 139