Remove Interactive Remove Metrics Remove Sales Remove Scorecard
article thumbnail

6 best practices for better vendor management

CIO Business Intelligence

Build proactive, collaborative partnerships For CIOs, the goal should be to evolve vendor relationships toward collaborative “partnerships” rather than just transactional engagements that crop up whenever the vendor needs a sale. Evaluating vendors for the best fits means looking at multiple levels of their operations. Allen says.

article thumbnail

A Guide To The Top 14 Types Of Reports With Examples Of When To Use Them

datapine

With this issue in mind, several BI tools have been developed to assist businesses in the generation of interactive reports with just a few clicks, enhancing the way companies make critical decisions and service insights from their most valuable data. Try our 14-day free trial & start building interactive reports today!

Reporting 201
Insiders

Sign Up for our Newsletter

This site is protected by reCAPTCHA and the Google Privacy Policy and Terms of Service apply.

Trending Sources

article thumbnail

Uncover The Power Of Monitoring Dashboards With Examples, Templates, & Design Tips

datapine

The image above is an example of a monitoring dashboard for sales. The level of interactivity provided by them allows you to navigate the data to find hidden insights that can boost your strategies. Choose relevant KPIs and metrics. Another important point to consider here is the importance of differentiating metrics from KPIs.

article thumbnail

13 power tips for Microsoft Power BI

CIO Business Intelligence

Power BI is Microsoft’s interactive data visualization and analytics tool for business intelligence (BI). With Power BI, you can pull data from almost any data source and create dashboards that track the metrics you care about the most. Power BI’s rich reports or dashboards can be embedded into reporting portals you already use.

article thumbnail

10 Ways That Corporate Dashboards Can Make Your Enterprise Life Easier

datapine

With dynamic features and a host of interactive insights, a business dashboard is the key to a more prosperous, intelligent business future. This most comprehensive of enterprise dashboard tools will make the task simpler with its logical design, interactive features, and cohesive mix of IT-centric KPIs. What Is A Corporate Dashboard?

article thumbnail

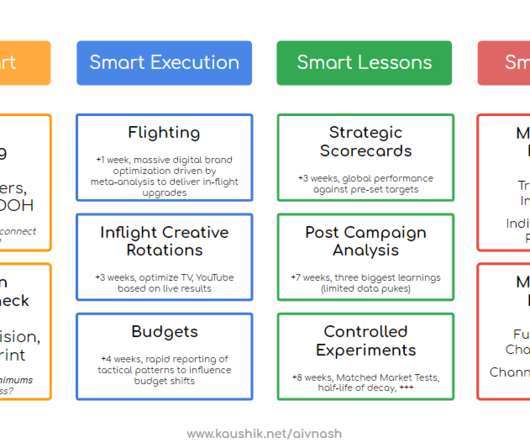
Analytics On The Bleeding Edge: Transforming Data's Influence

Occam's Razor

The other dimension to consider is most Analtyics teams kick into gear after the campaign is concluded, after the customer interaction has taken place in the call center, and after the funds budgeted have already been spent. The benchmark for the beautiful metric AVOC is 15.3%. sales) impact of my brand marketing?

Analytics 131
article thumbnail

Transforming IT for digital success

CIO Business Intelligence

Organizations that enhance customer experience can boost sales by upwards of 7% and profitability between 1% and 2% , according to management consulting firm McKinsey. Kanungo says CIOs must reduce the too-many formal interactions that happen and drive faster decision-making.

IT 135