Remove Key Performance Indicator Remove Presentation Remove ROI Remove Visualization
article thumbnail

13 Essential Data Visualization Techniques, Concepts & Methods To Improve Your Business – Fast

datapine

“By visualizing information, we turn it into a landscape that you can explore with your eyes. 90% of the information transmitted to the brain is visual. Data visualization methods refer to the creation of graphical representations of information. That’s where data visualization comes in. A sort of information map.

article thumbnail

Utilize The Potential Of Digital Dashboards In A Business Environment

datapine

Digital dashboards not only help you to drill down into the insights that matter most to your business, but they also offer an interactive visual representation that assists in swifter, more informed decision-making as well as the discovery of priceless new insights. But, with so much data and such little time, where do you even begin?

Insiders

Sign Up for our Newsletter

This site is protected by reCAPTCHA and the Google Privacy Policy and Terms of Service apply.

Trending Sources

article thumbnail

Top 15 Warehouse KPIs & Metrics For Efficient Management 

datapine

Therefore, it is very important to pick your indicators based on your actual needs. Now, let’s look at some benefits to keep putting the power of warehouse key performance indicators into perspective. In time, this will help you increase customer satisfaction and skyrocket warehouse ROI.

Metrics 217
article thumbnail

What Data Metrics Should Be Incorporated Into a Marketing Dashboard?

Smart Data Collective

Those insights need to be presented in a format that is easy to conceptualize. Visual marketing dashboards are prime examples of using big data effectively in marketing. In this day and age, all businesses must pay especially close consideration to the performance of their marketing metrics dashboard.

article thumbnail

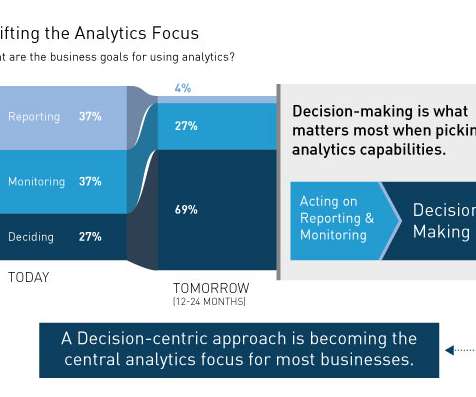
The Purpose of Analytics is not Reporting or Monitoring but Deciding

Decision Management Solutions

The research looked at the increasingly broad portfolio of analytic capabilities available to enterprises – everything from traditional Business Intelligence (BI) capabilities like reporting and ad-hoc queries to modern visualization and data discovery capabilities as well as advanced (predictive) analytics. Monitoring.

Reporting 134
article thumbnail

Move Beyond Excel, PowerPoint And Static Business Reporting with Powerful Interactive Dashboards

datapine

Visualizing the data and interacting on a single screen is no longer a luxury but a business necessity. Gone are the days of static presentations, stagnate reports, and waiting on analysts to pull reports and then having out-of-date data. They provide ROI by quickly highlighting trends and dig out irregularities.

article thumbnail

A Guide To The Methods, Benefits & Problems of The Interpretation of Data

datapine

Capable of displaying key performance indicators (KPIs) for both quantitative and qualitative data analyses, they are ideal for making the fast-paced and data-driven market decisions that push today’s industry leaders to sustainable success. Business dashboards are the digital age tools for big data.