article thumbnail

Unlocking the Power of Better Data Science Workflows

Smart Data Collective

Phase 3: Data Visualization. With the data analyzed and stored in spreadsheets, it’s time to visualize the data so that it can be presented in an effective and persuasive manner. Phase 4: Knowledge Discovery. This is also the period where specific questions are asked and confusion is cleared up.

article thumbnail

How Do Super Rookies Start Learning Data Analysis?

FineReport

Data analysis is a type of knowledge discovery that gains insights from data and drives business decisions. Professional data analysts must have a wealth of business knowledge in order to know from the data what has happened and what is about to happen. At the same time, it also advocates visual exploratory analysis.

Insiders

Sign Up for our Newsletter

This site is protected by reCAPTCHA and the Google Privacy Policy and Terms of Service apply.

article thumbnail

Why Establishing Data Context is the Key to Creating Competitive Advantage

Ontotext

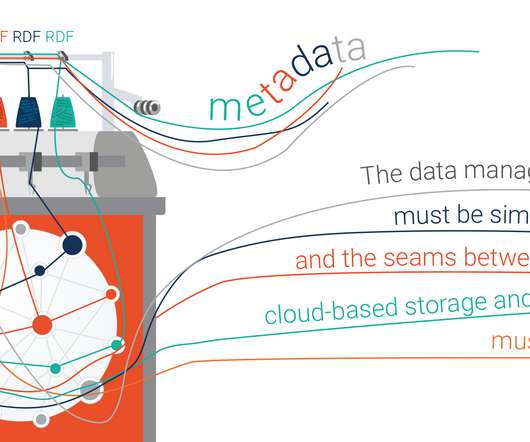
Beyond that, and without a way to visualize, connect, and utilize the data, it’s still just a bunch of random information. Semantically integrated data makes metadata meaningful, allowing for better interpretation, improved search, and enhanced knowledge-discovery processes.

article thumbnail

Understanding Social And Collaborative Business Intelligence

datapine

The three most important aspects of collaborative business intelligence are as follows: Knowledge Discovery : When IT departments isolate a user’s experience to mere reports, it can be quite stifling. Brings out all her thoughts and love in writing blogs on IoT, software, technology, etc. Website Link: [link] .

article thumbnail

GraphDB and metaphactory Part II: An RDF Database and A Knowledge Graph Platform in Action

Ontotext

This post looks at a specific clinical trial scoping example, powered by a knowledge graph that we have built for the EU funded project FROCKG , where both Ontotext and metaphacts are partners. Visual Ontology Modeling With metaphactory. Let’s first have a look at the knowledge graph management capabilities provided by metaphactory.

article thumbnail

Performing Non-Compartmental Analysis with Julia and Pumas AI

Domino Data Lab

We can now visually inspect the change in plasma concentration over time in the 5, 20, and 80mg profiles: Next, we call the Pumas read_nca function, which creates an NCAPopulation object containing preprocessed data for generation of all NCA values. pain_df.TIME.== 0, pain_df.DOSE, missing).

Metrics 59
article thumbnail

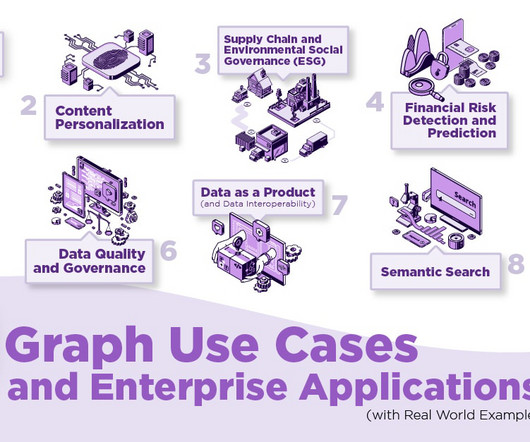
Top Graph Use Cases and Enterprise Applications (with Real World Examples)

Ontotext

Graphs boost knowledge discovery and efficient data-driven analytics to understand a company’s relationship with customers and personalize marketing, products, and services. Yet, the biggest challenge for risk analysis continues to suffer from lack of a scalable way of understanding how data is interrelated.