Remove Measurement Remove Structured Data Remove Unstructured Data Remove Visualization
article thumbnail

Data governance in the age of generative AI

AWS Big Data

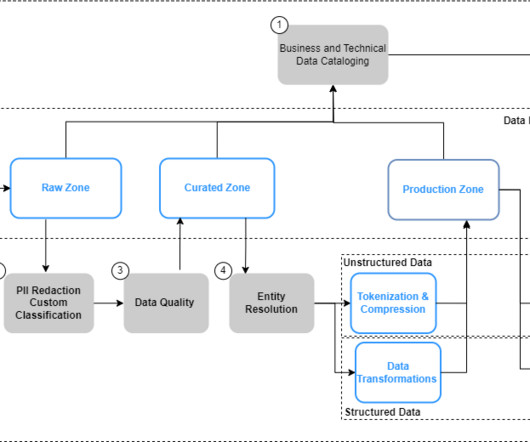
However, enterprise data generated from siloed sources combined with the lack of a data integration strategy creates challenges for provisioning the data for generative AI applications. As part of the transformation, the objects need to be treated to ensure data privacy (for example, PII redaction).

article thumbnail

The new challenges of scale: What it takes to go from PB to EB data scale

CIO Business Intelligence

Admittedly, it’s still pretty difficult to visualize this difference. This can be achieved by utilizing dense storage nodes and implementing fault tolerance and resiliency measures for managing such a large amount of data. Here is how Cloudera visualizes and controls the data lifecycle. Let’s take it to space.

Insiders

Sign Up for our Newsletter

This site is protected by reCAPTCHA and the Google Privacy Policy and Terms of Service apply.

Trending Sources

article thumbnail

How a Discovery Data Warehouse, the next evolution of augmented analytics, accelerates treatments and delivers medicines safely to patients in need

Cloudera

Sample and treatment history data is mostly structured, using analytics engines that use well-known, standard SQL. Interview notes, patient information, and treatment history is a mixed set of semi-structured and unstructured data, often only accessed using proprietary, or less known, techniques and languages.

article thumbnail

Quantitative and Qualitative Data: A Vital Combination

Sisense

Most commonly, we think of data as numbers that show information such as sales figures, marketing data, payroll totals, financial statistics, and other data that can be counted and measured objectively. This is quantitative data. It’s “hard,” structured data that answers questions such as “how many?”

article thumbnail

Top 10 Key Features of BI Tools in 2020

FineReport

The metadata here is focused on the dimensions, indicators, hierarchies, measures and other data required for business analysis. It also includes some processed data, such as KPI, personal sales, single product sales and other data. Interactive visual exploration. Self-service data preparation.

article thumbnail

The Superpowers of Ontotext’s Relation and Event Detector

Ontotext

Further, RED’s underlying model can be visually extended and customized to complex extraction and classification tasks. RED’s focus on news content serves a pivotal function: identifying, extracting, and structuring data on events, parties involved, and subsequent impacts. Here’s how our tool makes it work.

article thumbnail

Mastering Data Analysis Report and Dashboard

FineReport

However, due to regulatory controls on sensitive data like phone numbers and technical challenges in cross-platform integration of Internet and mobile reporting data, our current matching rates are relatively low, reaching around 20% in ideal scenarios, excluding telecom data.