Remove Metrics Remove Optimization Remove Sales Remove Scorecard
article thumbnail

A Beginner’s Guide To Inventory Metrics And Best Practices

datapine

In our cutthroat digital economy, massive amounts of data are gathered, stored, analyzed, and optimized to deliver the best possible experience to customers and partners. At the same time, inventory metrics are needed to help managers and professionals in reaching established goals, optimizing processes, and increasing business value.

Metrics 286
article thumbnail

A Complete Guide On How To Set Smart KPI Targets And Goals

datapine

It is not enough to track relevant customer or sales data. That said, there are various methods and tools businesses use to manage their data and optimize their performance. In short words, revenue is the money generated from normal business operations such as the sales of goods or services. Take a look at competitors.

KPI 152
Insiders

Sign Up for our Newsletter

This site is protected by reCAPTCHA and the Google Privacy Policy and Terms of Service apply.

article thumbnail

Transforming IT for digital success

CIO Business Intelligence

Organizations that enhance customer experience can boost sales by upwards of 7% and profitability between 1% and 2% , according to management consulting firm McKinsey. In this new world, IT must have a two-pronged strategy, one focused on cost optimization and the other on digital innovation, Palaniappan says.

IT 137
article thumbnail

Analytics On The Bleeding Edge: Transforming Data's Influence

Occam's Razor

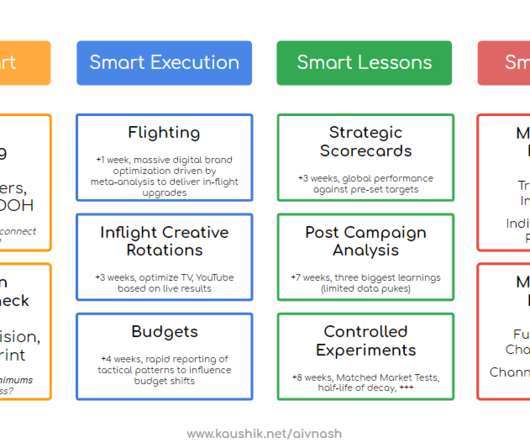
Executive scorecards, post-campaign analysis, some limited data puking (only when we absolutely can’t get away with it because someone who influences our existence is asking!), The benchmark for the beautiful metric AVOC is 15.3%. Now repeat this across many, many metrics, for many dimensions, in the three clusters you see above.

Analytics 131
article thumbnail

A Guide To The Top 14 Types Of Reports With Examples Of When To Use Them

datapine

By getting detailed information such as sales opportunities, a probability rate, as well as an accurate pipeline value forecast based on historical data, sales teams can prepare their strategies in advance, tackle any inefficiencies, and make informed decisions for increased efficiency. A good example is a KPI scorecard.

Reporting 201
article thumbnail

Google Analytics Tips: 10 Data Analysis Strategies That Pay Off Big!

Occam's Razor

On top of the graph click on Select A Metric and choose Goal Conversion Rate. As you look at the "scorecard" (just under the graph) you can look at the little numbers in gray and understand overall mobile performance compared to site performance. Put them on sale! Now you know the Visits and the Conversions.

Strategy 159
article thumbnail

10 Ways That Corporate Dashboards Can Make Your Enterprise Life Easier

datapine

Corporate (or enterprise) dashboards are dynamic digital and visual tools that offer a comprehensive working insight into a wide range of corporate or company’s metrics and data, focused on monitoring, optimization, and achievement of strategic goals. 2) CTO dashboard. 3) CMO dashboard. click to enlarge**.