Remove Metrics Remove Reporting Remove Visualization Remove Workshop
article thumbnail

Utilize The Effectiveness Of Professional Executive Dashboards & Reports

datapine

By gaining the ability to gather, organize and analyze the metrics that are most important to your organization, you stand to make your business empire more intelligent than ever before – and executive reporting and business dashboards will help you do just that. Exclusive Bonus Content: Executive Dashboards & Reports: A Summary.

article thumbnail

What Is An Operational Report? A Complete Guide

FineReport

Operational reports have the potential to greatly enhance business performance through the utilization of data-driven insights. These reports offer a structured and comprehensible representation of data, enabling a clearer understanding of complex issues that might otherwise remain elusive. What Is An Operational Report?

Insiders

Sign Up for our Newsletter

This site is protected by reCAPTCHA and the Google Privacy Policy and Terms of Service apply.

article thumbnail

9 Habits of Data Fluent Organizations — and How to Learn Them

Juice Analytics

With our book , resources and workshops, we’ve shared guidance about what it takes to become a data fluent organization. Habit 1: Define shared metrics Data fluency requires getting everyone on the same page as to what matters most. For difficult choices, we have shared baseline: How will it impact our North Star Metric?

Metrics 119
article thumbnail

Business Dashboard: Door To Acute Business Insights

FineReport

Several main benefits are as follows: Make key metrics clear. Metrics are an important criterion for judging the operation of various departments of an enterprise. Business dashboard highlights various business metrics. One of the vital reasons people resort to business dashboard is the visualization of data. Time-saving.

article thumbnail

Marie Kondo Has Some Advice for Your Dashboard

Juice Analytics

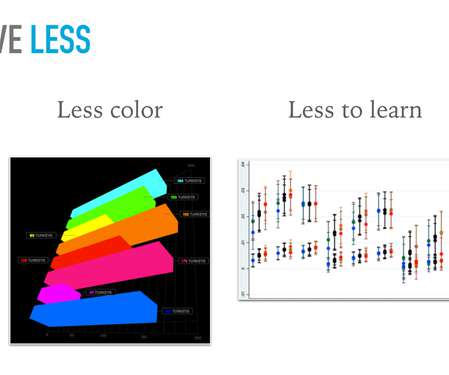
In our workshops on data storytelling, dashboard design, and data visualization, we are always emphasing the need to simplify. Instead of staring dejectedly into that mess of a closet, shift your gaze to that dashboard or report that you know needs some tough love. And certainly no more adding of metrics. Less is more.

article thumbnail

Digital Dashboard: Make You Prosper In Digital Era

FineReport

In general, digital dashboard integrates all key performance indicators and data into the dashboard of the same business area, so as to visually display the current status and historical trends of the company, and further assist the company’s decision-making. Workshop application of FineReport’s digital dashboard.

article thumbnail

Why you should care about debugging machine learning models

O'Reilly on Data

The study of security in ML is a growing field—and a growing problem, as we documented in a recent Future of Privacy Forum report. [8]. Partial dependence, accumulated local effect (ALE), and individual conditional expectation (ICE) plots : this involves systematically visualizing the effects of changing one or more variables in your model.