article thumbnail

A Mobile BI App Can Help Your Team Improve Efficiency!

Smarten

In fact, today’s productivity statistics have decreased in nearly all segments of the economy and improved productivity can provide a competitive edge and allow your business to function with fewer resources.

article thumbnail

Sisense’s Q2 Release: A Modern Data Experience Across the Analytics Continuum

Sisense

Another feature of In-Warehouse Data Prep is the warehouse statistics profiling view, which allows users to understand their data at a glance, identifying patterns, relationships, and unexpected values. In-Warehouse Data Prep supports both AWS Redshift and Snowflake data warehouses. Self-service dashboards: Your insights, your way.

Insiders

Sign Up for our Newsletter

This site is protected by reCAPTCHA and the Google Privacy Policy and Terms of Service apply.

Trending Sources

article thumbnail

5 tips for excelling at self-service analytics

CIO Business Intelligence

They’re not required to have any experience with analytics or background in statistics or other related disciplines. Users have freedom to slice and dice the data without technical know-how,” he says. Business departments can create their own queries and reports and collaborate without the need for support from IT, Singh says.

Analytics 134
article thumbnail

What is Automated Data Discovery?

Octopai

– Visualizing your data landscape: By slicing and dicing the data landscape in different ways, what connections, relationships, and outliers can be found? – Analyzing the data: Using statistical methods, what insights can be gained by summarizing the data? What data models can be built from these relationships?

article thumbnail

Data scientist as scientist

The Unofficial Google Data Science Blog

Note also that this account does not involve ambiguity due to statistical uncertainty. As you can see from the tiny confidence intervals on the graphs, big data ensured that measurements, even in the finest slices, were precise. We sliced and diced the experimental data in many many ways.

article thumbnail

Measuring Validity and Reliability of Human Ratings

The Unofficial Google Data Science Blog

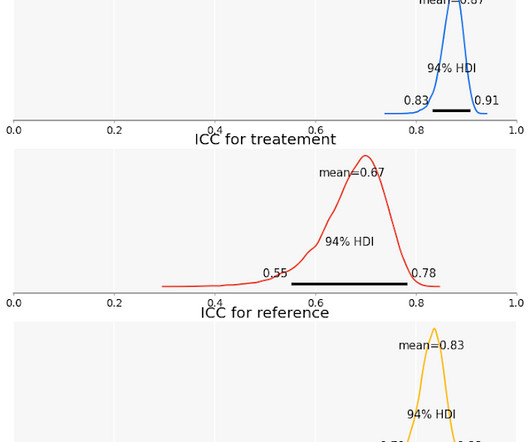
Editor's note : The relationship between reliability and validity are somewhat analogous to that between the notions of statistical uncertainty and representational uncertainty introduced in an earlier post. If they roll two dice and apply a label if the dice rolls sum to 12 they will agree 85% of the time, purely by chance.

article thumbnail

Great Storytelling With Data: Visualize Simply And Focus Obsessively

Occam's Razor

conversion rate (it might not be statistically significant!). Very often at Analysts and Researchers we are so into the data, slicing and dicing it, and in trying to get something decent out of that work, that we fail to actually see the data. There are many standard data presentation strategies you should use all the time.