Remove 2009 Remove Optimization Remove Statistics Remove Visualization
article thumbnail

Fitting Support Vector Machines via Quadratic Programming

Domino Data Lab

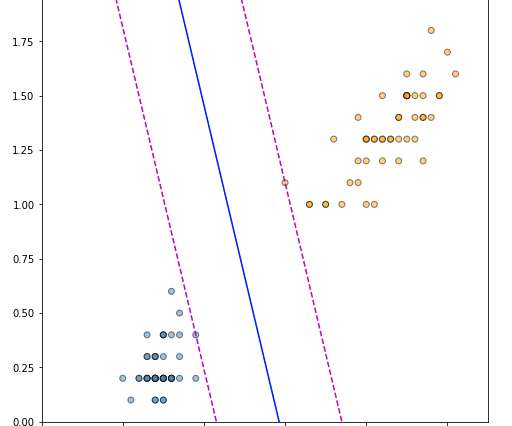
Selecting the optimal decision boundary, however, is not a straightforward process. The distance from an arbitrary data point (boldsymbol{x}_i) to the optimal hyperplane in our case is given by. We now turn our attention to the problem of finding the optimal hyperplane. Derivation of a Linear SVM.

article thumbnail

Themes and Conferences per Pacoid, Episode 9

Domino Data Lab

On the other hand, as Lipton emphasized, while the tooling produces interesting visualizations, visualizations do not imply interpretation. ML model interpretability and data visualization. From my experiences leading data teams, when a business is facing difficult challenges, data visualizations can help or hurt.

Insiders

Sign Up for our Newsletter

This site is protected by reCAPTCHA and the Google Privacy Policy and Terms of Service apply.

Trending Sources

article thumbnail

Fitting Bayesian structural time series with the bsts R package

The Unofficial Google Data Science Blog

SCOTT Time series data are everywhere, but time series modeling is a fairly specialized area within statistics and data science. They may contain parameters in the statistical sense, but often they simply contain strategically placed 0's and 1's indicating which bits of $alpha_t$ are relevant for a particular computation. by STEVEN L.

article thumbnail

Adding Common Sense to Machine Learning with TensorFlow Lattice

The Unofficial Google Data Science Blog

On the one hand, basic statistical models (e.g. The first is that they are straightforward to optimize using traditional gradient-based optimizers as long as we pre-specify the placement of the knots. There is a robust set of tools for working with these kinds of constrained optimization problems. References Wightman, L.

article thumbnail

Data Science at The New York Times

Domino Data Lab

When he retired in 2009 he had some time on his hands. or are you looking for me to help you decide on what is the optimal treatment in order to get the outcome you want?” It’s a visual problem so it works both in our MSE and it works by your eyeballs. For visualization we’re not building our own dashboards.