
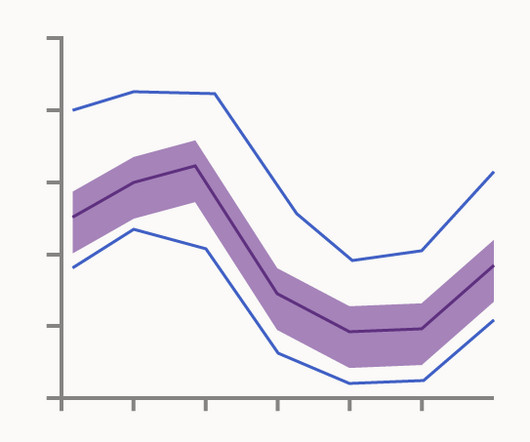
Chart Snapshot: Functional Box Plots
The Data Visualisation Catalogue
APRIL 26, 2024
GENTON, October 2010, Journal of Computational and Graphical Statistics 20(2) DOI:10.2307/23110490 Adjusted functional boxplots for spatio-temporal data visualization and outlier detection Sun, Y. Examples Functional Boxplot of Sun Surface Temperature Wikipedia Functional boxplot for data polluted with 0%, 10%, 25%, and 45% shape outliers.


Let's personalize your content