Remove 2012 Remove Dashboards Remove Data Collection Remove Visualization
article thumbnail

A Guide To The Methods, Benefits & Problems of The Interpretation of Data

datapine

4) Data Analysis & Interpretation Problems. 5) Data Interpretation Techniques & Methods. 6) The Use of Dashboards For Data Interpretation. Data analysis and interpretation have now taken center stage with the advent of the digital ageā€¦ and the sheer amount of data can be frightening.

article thumbnail

Designing Visual Appendices for Your Next Reportā€”In Under an Hour

Depict Data Studio

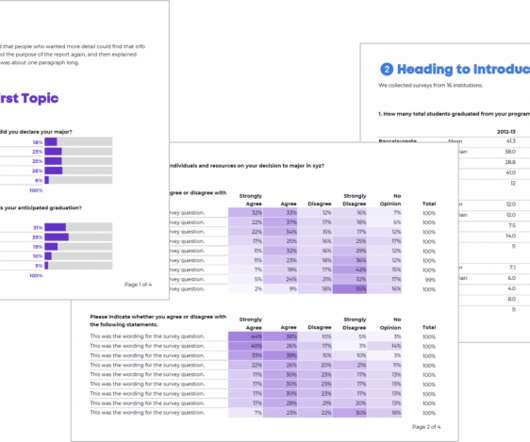
tables and tables of closed-ended and open-ended survey data) Data collection instruments (e.g., our reportā€™s main body could focus on this yearā€™s data , but we might include tables that compare this yearā€™s data to last yearā€™s data in the appendix). Introducingā€¦ Visual Appendices! Third, add visuals!

Insiders

Sign Up for our Newsletter

This site is protected by reCAPTCHA and the Google Privacy Policy and Terms of Service apply.

Trending Sources

article thumbnail

NHL turns to venue metrics data to drive sustainability

CIO Business Intelligence

To reduce its carbon footprint and mitigate climate change, the National Hockey League (NHL) has turned to data and analytics to gauge the sustainability performance of the arenas where its teams play. Data reporting and insights: A visualization dashboard shows environmental, consumption, and financial metrics.

Metrics 144
article thumbnail

Global Multichannel Consumer Behaviour (Research/Purchase) Analysis

Occam's Razor

Please visit the about page to learn more about the data collection methodology, sample sizes, and the Enumeration study to ensure results are representative, and to download the detailed questionnaires used for each study. You are also able to filter all the above data by: Gender, Age, Education and Internet Usage.

article thumbnail

Top 24 RPA tools available today

CIO Business Intelligence

Appian RPAā€™s low-code integrated development environment (IDE) encourages fast creation of custom bots, while the dashboard tracks all the operating robots and can create a video of the screen to help debug the bots deployed across Appianā€™s cloud. It offers migration from desktop to a cloud solution, and an open-source edition.