Remove 2012 Remove Dashboards Remove Marketing Remove Visualization
article thumbnail

A Guide To The Methods, Benefits & Problems of The Interpretation of Data

datapine

6) The Use of Dashboards For Data Interpretation. In fact, a Digital Universe study found that the total data supply in 2012 was 2.8 Business dashboards are the digital age tools for big data. Typically, quantitative data is measured by visually presenting correlation tests between two or more variables of significance.

article thumbnail

Performance Dashboard: Facilitate The Performance of Your Business

FineReport

Performance dashboard can help you deal with various business problems. What is a performance dashboard? Companies can use performance dashboards to guide various indicators, ranging from checking the ability of a department to monitoring the availability of business strategies for global organizations.

Insiders

Sign Up for our Newsletter

This site is protected by reCAPTCHA and the Google Privacy Policy and Terms of Service apply.

article thumbnail

Introduction To The Basic Business Intelligence Concepts

datapine

Business intelligence concepts refer to the usage of digital computing technologies in the form of data warehouses, analytics and visualization with the aim of identifying and analyzing essential business-based data to generate new, actionable corporate insights. They enable powerful data visualization. But more on that later.

article thumbnail

Accelerate analytics on Amazon OpenSearch Service with AWS Glue through its native connector

AWS Big Data

Data is stored from online systems such as the databases, CRMs, and marketing systems to data stores such as data lakes on Amazon Simple Storage Service (Amazon S3), data warehouses in Amazon Redshift , and purpose-built stores such as Amazon OpenSearch Service , Amazon Neptune , and Amazon Timestream. Attach the following policy to the role.

article thumbnail

Perform secure database write-backs with Amazon QuickSight

AWS Big Data

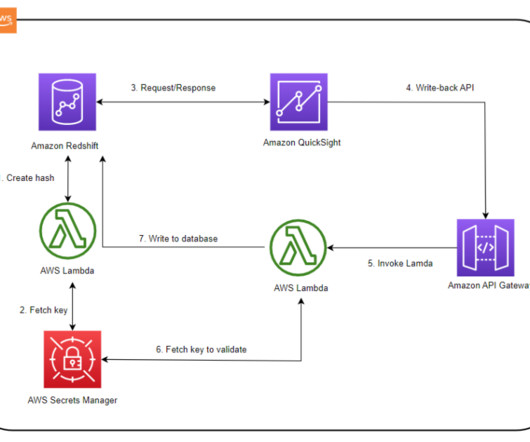
A write-back is the ability to update a data mart, data warehouse, or any other database backend from within BI dashboards and analyze the updated data in near-real time within the dashboard itself. AnyCompany wants to build a new dashboard with quote history data for analysis and business insights.

article thumbnail

Centralize near-real-time governance through alerts on Amazon Redshift data warehouses for sensitive queries

AWS Big Data

We also create a simple governance dashboard using a combination of Amazon DynamoDB , Amazon Athena , and Amazon QuickSight. The Lambda function stores the data in a DynamoDB table over which a simple dashboard is built using Athena and QuickSight. Choose PUBLISH & VISUALIZE. The AWS Region used for this post is us-east-1.

article thumbnail

Upcoming Power BI Workshop in Huntington Beach, CA – Apr 10, 2015

Ms SQL Girl

Actionable Visualization In Power BI. Power Query 101 (for Power BI Dashboard). Publishing and Administering Dashboards and Reports in Power BI for the Organisation. Her recent projects include delivering a SQL Server 2012 Data Warehouse and BI solutions for a number of high profile clients in the US and Australia.