Remove 2017 Remove Data mining Remove Measurement Remove Visualization
article thumbnail

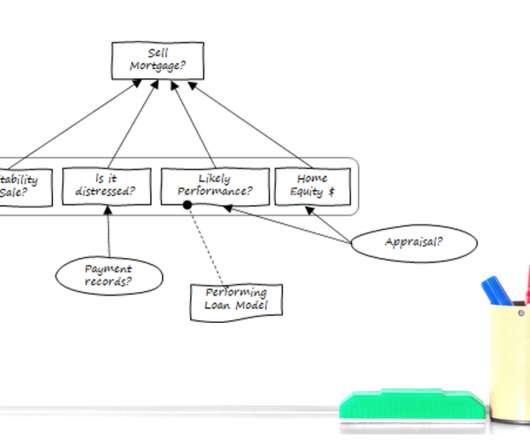
Make Your Investment in Analytic Technology Pay Off With Decision Requirements Modeling

Decision Management Solutions

Like many enterprises, you’ve likely made a hefty investment in analytic technology—from interactive dashboards and advanced visualization tools to data mining, predictive analytics, machine learning (ML), and artificial intelligence (AI). 1 MIT Sloan Management Review September 06, 2017.

article thumbnail

Top 10 Analytics And Business Intelligence Trends For 2020

datapine

Data exploded and became big. Spreadsheets finally took a backseat to actionable and insightful data visualizations and interactive business dashboards. The rise of self-service analytics democratized the data product chain. 2) Data Discovery/Visualization. We all gained access to the cloud.

Insiders

Sign Up for our Newsletter

This site is protected by reCAPTCHA and the Google Privacy Policy and Terms of Service apply.

article thumbnail

ML internals: Synthetic Minority Oversampling (SMOTE) Technique

Domino Data Lab

Working with highly imbalanced data can be problematic in several aspects: Distorted performance metrics — In a highly imbalanced dataset, say a binary dataset with a class ratio of 98:2, an algorithm that always predicts the majority class and completely ignores the minority class will still be 98% correct. Machine Learning, 57–78.

article thumbnail

Explaining black-box models using attribute importance, PDPs, and LIME

Domino Data Lab

Skater provides a wide range of algorithms that can be used for visual interpretation (e.g. but it generally relies on measuring the entropy in the change of predictions given a perturbation of a feature. In IJCAI 2017 Workshop on Explainable Artificial Intelligence (XAI), pages 24–30, Melbourne, Australia, 2017.

Modeling 139
article thumbnail

Towards optimal experimentation in online systems

The Unofficial Google Data Science Blog

the weight given to Likes in our video recommendation algorithm) while $Y$ is a vector of outcome measures such as different metrics of user experience (e.g., Taking measurements at parameter settings further from control parameter settings leads to a lower variance estimate of the slope of the line relating the metric to the parameter.

article thumbnail

What Is Data Intelligence?

Alation

Data catalogs then integrate compliance at the point of consumption, so people are alerted to sensitive data where it lives. Source: “What’s Your Data Strategy?” HBR Review May/June 2017. Data Intelligence and Metadata. Data intelligence is fueled by metadata. Implement Data Intelligence Software.