article thumbnail

Exploring US Real Estate Values with Python

Domino Data Lab

Models are at the heart of data science. Data exploration is vital to model development and is particularly important at the start of any data science project. From 2010 to 2017, the median price of a single-family home in San Francisco has gone from approximately $775,000 to $1.5 Interactive Data Visualization in Python.

article thumbnail

AI for Climate Change and Weather Risk

DataRobot Blog

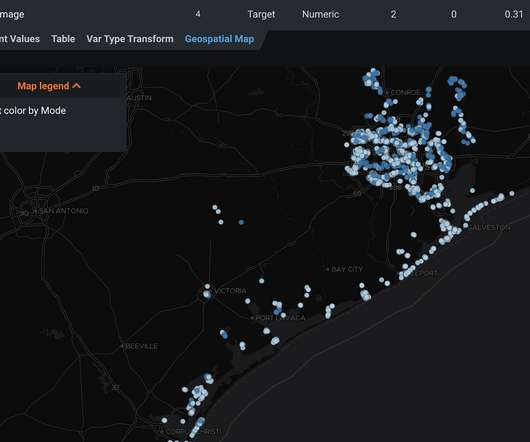
In 2017, Hurricane Harvey struck the U.S. DataRobot enables the user to easily combine multiple datasets into a single training dataset for AI modeling. The DataRobot AI Cloud Platform can also help identify infrastructure and buildings at risk of damage from natural disasters.

Risk 52
Insiders

Sign Up for our Newsletter

This site is protected by reCAPTCHA and the Google Privacy Policy and Terms of Service apply.

article thumbnail

Topics to watch at the Strata Data Conference in New York 2019

O'Reilly on Data

Our call for speakers for Strata NY 2019 solicited contributions on the themes of data science and ML; data engineering and architecture; streaming and the Internet of Things (IoT); business analytics and data visualization; and automation, security, and data privacy. An ML-related topic, “models,” was No. This year, AI sits at No.

IoT 20
article thumbnail

Techniques for Collecting, Prepping, and Plotting Data: Predicting Social Media-Influence in the NBA

Domino Data Lab

Knowing that the ultimate goal is to compare the social-media influence and power of NBA players, a great place to start is with the roster of the NBA players in the 2016–2017 season. A further diagnostic step is to plot the predicted values of the linear regression versus the actual values. ggtitle("NBA Teams 2016-2017 Faceted Plot").

article thumbnail

Explaining black-box models using attribute importance, PDPs, and LIME

Domino Data Lab

In this article we’ll use Skater , a freely available framework for model interpretation, to illustrate some of the key concepts above. Skater provides a wide range of algorithms that can be used for visual interpretation (e.g. layer-wise relevance propagation), model distillation (e.g. Partial Dependence Plots (PDPs).

Modeling 139
article thumbnail

Top 10 Analytics And Business Intelligence Trends For 2020

datapine

Spreadsheets finally took a backseat to actionable and insightful data visualizations and interactive business dashboards. Companies are no longer wondering if data visualizations improve analyses but what is the best way to tell each data-story. 2) Data Discovery/Visualization. Data exploded and became big.