Remove 2019 Remove Blog Remove Dashboards Remove Statistics
article thumbnail

The Top 20 Data Visualization Books That Should Be On Your Bookshelf

datapine

But often that’s how we present statistics: we just show the notes, we don’t play the music.” – Hans Rosling, Swedish statistician. 3) “The Big Book Of Dashboards: Visualizing Your Data Using Real-World Business Scenarios” by Steve Waxler, Jeffrey Shaffer, and Andy Cotgreave. datapine is filling your bookshelf thick and fast.

article thumbnail

Unleash the Power of Advanced Analytics with the Sisense Q4 2019 Release

Sisense

The merger of Periscope Data in May 2019 brings robust functionality for cloud data experts to work with their data as needed while supporting a wide breadth of users and use cases. Data is the New Oil” was coined by The Economist in May 2017 and became a mantra for organizations to drive new wealth from data. Talk to your data.

Insiders

Sign Up for our Newsletter

This site is protected by reCAPTCHA and the Google Privacy Policy and Terms of Service apply.

Trending Sources

article thumbnail

A Brief History of Data Visualization

Jet Global

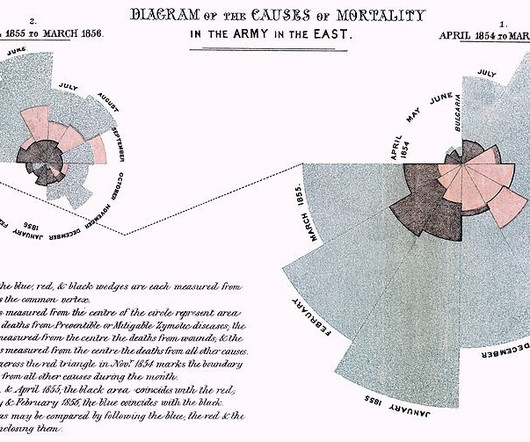
Editors note: This blog was originally published in October 2013, and has been completely revamped and updated for accuracy, relevancy, and comprehensiveness in September 2019 Prior to the 17th century, data visualization existed mainly in the realm of maps, displaying land markers, cities, roads, and resources.

article thumbnail

Sisense’s Q2 Release: A Modern Data Experience Across the Analytics Continuum

Sisense

Another feature of In-Warehouse Data Prep is the warehouse statistics profiling view, which allows users to understand their data at a glance, identifying patterns, relationships, and unexpected values. Self-service dashboards: Your insights, your way. Her debut novel, The Book of Jeremiah , was published in 2019.

article thumbnail

Top 10 Analytics And Business Intelligence Trends For 2020

datapine

Spreadsheets finally took a backseat to actionable and insightful data visualizations and interactive business dashboards. 2019 was a particularly major year for the business intelligence industry. The rise of self-service analytics democratized the data product chain. Suddenly advanced analytics wasn’t just for the analysts.

article thumbnail

Data Visualization and Visual Analytics: Seeing the World of Data

Sisense

Data is usually visualized in a pictorial or graphical form such as charts, graphs, lists, maps, and comprehensive dashboards that combine these multiple formats. They are transformed into data visualizations and shared via dashboards and analytic apps so that users can make smarter, data-driven decisions.

article thumbnail

Discover 20 Essential Types Of Graphs And Charts And When To Use Them

datapine

2) Charts And Graphs Categories 3) 20 Different Types Of Graphs And Charts 4) How To Choose The Right Chart Type Data and statistics are all around us. That said, there is still a lack of charting literacy due to the wide range of visuals available to us and the misuse of statistics. Table of Contents 1) What Are Graphs And Charts?