Remove 2020 Remove Business Intelligence Remove Forecasting Remove KPI
article thumbnail

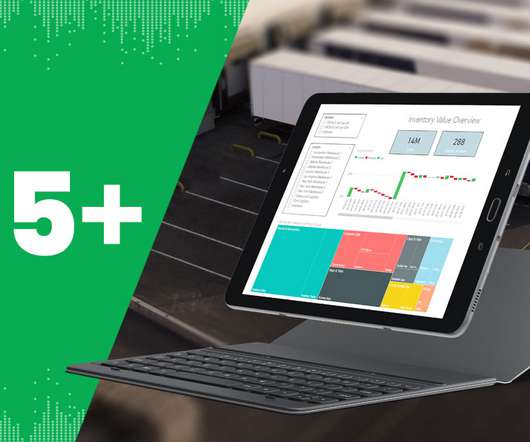
Top 35+ Distribution KPIs and Metric Examples for 2020 Reporting

Jet Global

What Is a Distribution KPI? A distribution Key Performance Indicator (KPI) or metric is a measure that a company in the distribution sector uses to monitor its performance and efficiency. These metrics help companies identify areas of operational success and failure through measuring specific quantifiable aspects of their business.

Metrics 52
article thumbnail

An Introduction To Data Dashboards: Meaning, Definition & Industry Examples

datapine

According to the EMC Digital Universe study, by 2020, around 40 trillion megabytes – or 40 zettabytes – will exist in our digital landscape. Enter data dashboards – one of history’s best innovations in business intelligence. When it comes to business intelligence, data dashboards play a pivotal role.

Insiders

Sign Up for our Newsletter

This site is protected by reCAPTCHA and the Google Privacy Policy and Terms of Service apply.

Trending Sources

article thumbnail

30 Best Manufacturing KPIs and Metric Examples for 2020 Reporting

Jet Global

What Is A Manufacturing KPI? A manufacturing Key Performance Indicator (KPI) or metric is a well defined and quantifiable measure that the manufacturing industry uses to gauge its performance over time. Why Your Company Should Be Using Manufacturing Specific KPIs to Stay Competitive. How to Build Useful KPI Dashboards.

article thumbnail

Take Complete Charge Of Customer Satisfaction Metrics – Customer Effort Score, NPS & Customer Satisfaction Score

datapine

Businesses that want to retain their customers, increase consumer loyalty, and encourage brand advocacy must provide personalized, responsive, seamless experiences across all channels and touchpoints. Exclusive Bonus Content: Get our short guide to CES and NPS! Read here how these metrics can drive your customers’ satisfaction up!

Metrics 134
article thumbnail

Gartner D&A Summit Bake-Offs Explored Flooding Impact And Reasons for Optimism!

Rita Sallam

In 2020, we analyzed population health data. An autocorrelation forecasting model to identify parameter estimators, associated with relevant variables, that impact the likelihood of flooding events. Between the years 2000 and 2020, river flooding in Louisiana caused crop damages worth $270 million and property damages worth $9.1

article thumbnail

What AI Means to a Data Scientist

Birst BI

For example, there are a plethora of software tools available to automatically develop predictive models from relational data, and according to Gartner, “By 2020, more than 40% of data science tasks will be automated, resulting in increased productivity and broader usage by citizen data scientists.” [1]

article thumbnail

Top 10 Key Features of BI Tools in 2020

FineReport

Nowadays, the business intelligence market is heating up. Both the investment community and the IT circle are paying close attention to big data and business intelligence. The metadata here is focused on the dimensions, indicators, hierarchies, measures and other data required for business analysis.