Remove Analytics Remove Dashboards Remove IT Remove Key Performance Indicator
article thumbnail

Make Sure You Know The Difference Between Strategic, Analytical, Operational And Tactical Dashboards

datapine

This is where the power of business dashboards comes into play. Dashboards often are the best way to gain insight into an organization and its various departments, operations and performance. Well-built, focused dashboards easily serve up summaries and reports of the BI that’s most critical to the organization.

article thumbnail

Your Introduction To CFO Dashboards & Reports In The Digital Age

datapine

CFO dashboards exist to enhance the strategic as well as the analytical efforts related to every financial aspect of your business. Here, we’ll explore the dynamics of reports for CFOs, look at CFO reporting tools, and consider real-world examples of both CFO dashboards and reports. What Is A CFO Dashboard?

Insiders

Sign Up for our Newsletter

This site is protected by reCAPTCHA and the Google Privacy Policy and Terms of Service apply.

Trending Sources

article thumbnail

An Introduction To Data Dashboards: Meaning, Definition & Industry Examples

datapine

Enter data dashboards – one of history’s best innovations in business intelligence. To help you understand this notion in full, we’re going to explore a data dashboard definition, explain the power of dashboard data, and explore a selection of data dashboard examples. What Is A Data Dashboard? Arthur Conan Doyle.

article thumbnail

Apply Modern CRM Dashboards & Reports Into Your Business – Examples & Templates

datapine

With a powerful dashboard maker , each point of your customer relations can be optimized to maximize your performance while bringing various additional benefits to the picture. Your Chance: Want to build professional CRM reports & dashboards? Your Chance: Want to build professional CRM reports & dashboards?

article thumbnail

Utilize The Potential Of Digital Dashboards In A Business Environment

datapine

“Without big data analytics, companies are blind and deaf, wandering out onto the web like deer on a freeway.” – Geoffrey Moore. A data-driven business dashboard is your gateway to advanced business intelligence (BI) – the kind that will accelerate your success in an increasingly competitive commercial world.

article thumbnail

14 Dashboard Design Principles & Best Practices To Enhance Your Data Analysis

datapine

The rise of innovative, interactive, data-driven dashboard tools has made creating effective dashboards – like the one featured above – swift, simple, and accessible to today’s forward-thinking businesses. Dashboard design should be the cherry on top of your business intelligence (BI) project. Consider your end goal.

article thumbnail

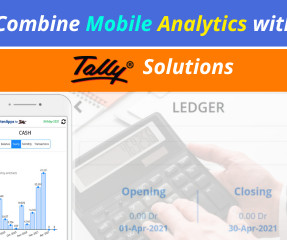
Combine Mobile Analytics with Tally Solutions!

Smarten

Get the Most Out of Your Tally Solution with Integrated Mobile Augmented Analytics! Comprehensive business intelligence and analytical tools support your team with intuitive dashboards, key performance indicators (KPIs), visualization, charts, graphs and metrics that will allow you to gain a competitive edge.’