Remove Analytics Remove Dashboards Remove Measurement Remove Scorecard
article thumbnail

Build Up Your Performance With KPI Scorecards – Examples & Templates

datapine

Tracking the success metrics based on your needs, and the time frame you select while comparing your values can be done with simple yet effective scorecards. What Is A KPI Scorecard? A KPI scorecard is a term used to describe a statistical record that measures progress or achievement towards a set performance indicator.

Scorecard 226
article thumbnail

A Beginner’s Guide To Inventory Metrics And Best Practices

datapine

In the matter, data analysis and dashboard designer software is a precious ally. We will finish by presenting a business dashboard that will show how those metrics work together when depicting an inventory data-story. It is measured by dividing the available inventory for sale by the quantity that is actually sold.

Metrics 286
Insiders

Sign Up for our Newsletter

This site is protected by reCAPTCHA and the Google Privacy Policy and Terms of Service apply.

article thumbnail

Visualize data quality scores and metrics generated by AWS Glue Data Quality

AWS Big Data

AWS Glue Data Quality allows you to measure and monitor the quality of data in your data repositories. An operational scorecard is a mechanism used to evaluate and measure the quality of data processed and validated by AWS Glue Data Quality rulesets. The following architecture diagram shows an overview of the complete pipeline.

article thumbnail

A Complete Guide On How To Set Smart KPI Targets And Goals

datapine

In order to really ensure you are growing and making the most out of your data-driven efforts, it is necessary to implement measurable goals that will allow you to efficiently assess your strategic efforts. KPIs are a type of measurement that helps organizations evaluate their success in different activities and areas.

KPI 152
article thumbnail

10 Best Big Data Analytics Tools You Need To Know in 2023

FineReport

In this article, we will explore the importance of Big Data, why enterprises need Big Data tools, how to choose the right Big Data analytics tools and provide a list of the top 10 Big Data analytics tools available today. Descriptive Analytics is used to determine “what happened and why.” What is Big Data?

article thumbnail

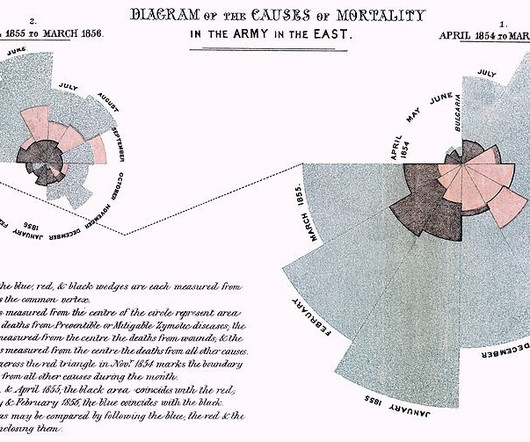
A Brief History of Data Visualization

Jet Global

As the demand grew for more accurate mapping and physical measurement, better visualizations were needed. Abstract graphs of functions, measurement error, and collection of empirical data were introduced at this time. The 18th century saw the beginning of thematic mapping.

article thumbnail

10 Ways That Corporate Dashboards Can Make Your Enterprise Life Easier

datapine

Whatever your sector or niche, if you want to remain adaptable and get one step ahead of the competition, working with the right data-driven tools and utilizing a corporate dashboard is essential. That’s where corporate dashboards come in. Your Chance: Want to create your own dynamic corporate dashboard? 1) CFO dashboard.