Remove Article Remove Business Analysis Remove Dashboards Remove Visualization
article thumbnail

Financial Dashboard: Definition, Examples, and How-tos

FineReport

In today’s dynamic business environment, gaining comprehensive visibility into financial data is crucial for making informed decisions. This is where the significance of a financial dashboard shines through. What is A Financial Dashboard? You can download FineReport for free and have a try! Free Download of FineReport 1.

article thumbnail

Reporting Solutions: A Complete Guide

FineReport

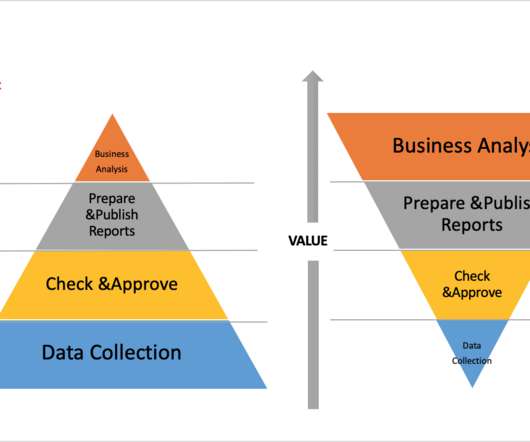
For most companies, the staffs spend 50% time on data collection, 30% time on checking and approving the data, 15% time on developing and publishing the reports, and 5% on business analysis. However, it is evident that the value of data collection for business decisions is minimal, but the value of data analysis is the greatest.

Insiders

Sign Up for our Newsletter

This site is protected by reCAPTCHA and the Google Privacy Policy and Terms of Service apply.

article thumbnail

Financial Statements: Types, Examples, and Analysis

FineReport

This heightened clarity positions financial statements as a focal point for the management team, who place a greater emphasis on their analysis to gain profound insights into the company’s financial well-being. Note: All the reports in this article are created using the professional enterprise-level reporting software FineReport.

article thumbnail

Top 5 BI tools of 2019: Comparison and How to decide

FineReport

BI software assists businesses with data display and analytics to help companies discover the situations, market challenges, as well as the chance. In this article, I compared the top 5 BI tools of 2019 based on the overall ease-of-use, BI features, and the price. Pro: Stunning Data Visualization . Pro: R script visualization.

article thumbnail

How Do Super Rookies Start Learning Data Analysis?

FineReport

Taking FineReport as an example, it is a BI reporting tool that can connect to various data sources, quickly analyze the data, and make various reports and cool dashboards. At the same time, it also advocates visual exploratory analysis. The visualization component library of FineReport is very rich.

article thumbnail

Business Intelligence Dashboard Software: Make Business Successful

FineReport

Living in a digital era, foresighted enterprises resort to business intelligence to improve their competitiveness. Among amounts of intelligent choices, business intelligence(BI) dashboard software is an awesome one. BI dashboard software definition. Sales analysis dashboard(by FineReport). FineReport.

article thumbnail

10 Best Dashboard Design Tips, Templates & How-To’s

FineReport

In this data-driven era, data visualization is indispensable in business operations. The most predominant means to visualize data is the application of various dashboards. The dashboard design has naturally become an important point that cannot be ignored. Dashboard Design Tips. What is a Dashboar d.