article thumbnail

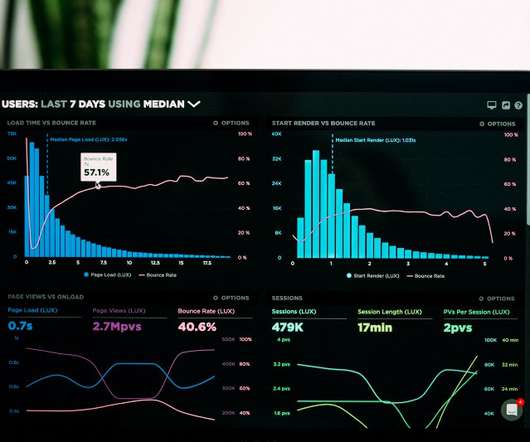
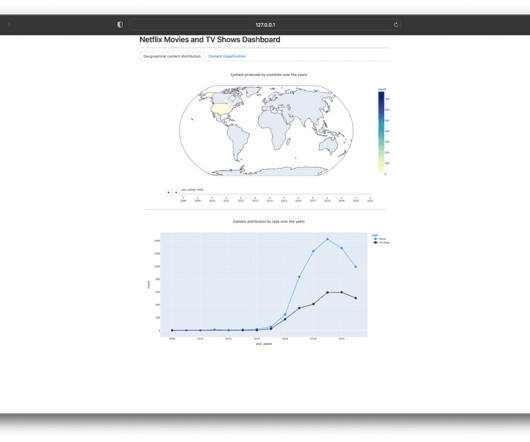
Create Stock Exchange Dashboard using Dash in Python!

Analytics Vidhya

This article was published as a part of the Data Science Blogathon Introduction Dash is an open-source web framework for creating analytical dashboards and data visualizations. It helps data analysts to deploy dashboards and serve these dashboards to the main web application. appeared first on Analytics Vidhya.

article thumbnail

Create Interactive Dashboards with Streamlit and Python

Analytics Vidhya

This article was published as a part of the Data Science Blogathon. Introduction In Data Visualization, Dashboard is the great Graphical User Interfaces that. The post Create Interactive Dashboards with Streamlit and Python appeared first on Analytics Vidhya.

Insiders

Sign Up for our Newsletter

This site is protected by reCAPTCHA and the Google Privacy Policy and Terms of Service apply.

article thumbnail

Building an Interactive Dashboard using Bokeh and Pandas

Analytics Vidhya

This article was published as a part of the Data Science Blogathon image source: Author The Importance of Data Visualization A huge amount of data is being generated every instant due to business activities in globalization. The post Building an Interactive Dashboard using Bokeh and Pandas appeared first on Analytics Vidhya.

article thumbnail

How to Create Stunning and Interactive Dashboards in Excel?

Analytics Vidhya

This article was published as a part of the Data Science Blogathon Introduction I have been using Pandas with Python and Plotly to create some of the most stunning dashboards for my projects. The post How to Create Stunning and Interactive Dashboards in Excel? The post How to Create Stunning and Interactive Dashboards in Excel?

article thumbnail

Guide For Data Analysis: From Data Extraction to Dashboard

Analytics Vidhya

This article was published as a part of the Data Science Blogathon Introduction I have been associated with Analytics Vidya from the 3rd edition of Blogathon. The post Guide For Data Analysis: From Data Extraction to Dashboard appeared first on Analytics Vidhya.

article thumbnail

Dynamic Dashboards using Google Data Studio

Analytics Vidhya

ArticleVideo Book This article was published as a part of the Data Science Blogathon. The post Dynamic Dashboards using Google Data Studio appeared first on Analytics Vidhya. Numbers have an important story to tell.

article thumbnail

Building a Covid-19 Vaccination Dashboard in Tableau

Analytics Vidhya

ArticleVideo Book This article was published as a part of the Data Science Blogathon. Introduction Tableau is a powerful Data Visualization software, and much. The post Building a Covid-19 Vaccination Dashboard in Tableau appeared first on Analytics Vidhya.