article thumbnail

What is ARIMAX Forecasting and How is it Used for Enterprise Analysis?

Smarten

This article looks at the ARIMAX Forecasting method of analysis and how it can be used for business analysis. What is ARIMAX Forecasting? This method is suitable for forecasting when data is stationary/non stationary, and multivariate with any type of data pattern, i.e., level/trend /seasonality/cyclicity.

article thumbnail

Why Low-Code No-Code is Important for BI Tools!

Smarten

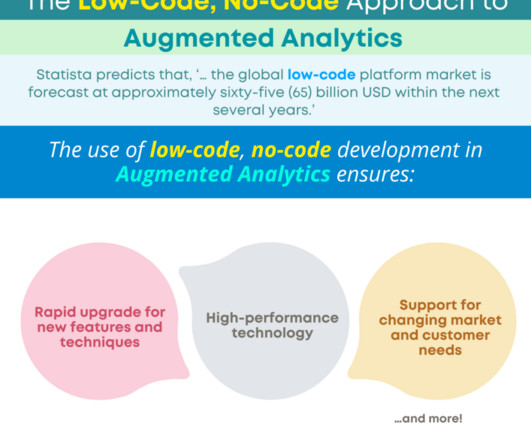
This explanation provides a simple understanding of both approaches and, for the purpose of this article, we will not dive into the details. Statista predicts that, ‘… the global low-code platform market is forecast at approximately sixty-five (65) billion USD within the next several years.’

Insiders

Sign Up for our Newsletter

This site is protected by reCAPTCHA and the Google Privacy Policy and Terms of Service apply.

Trending Sources

article thumbnail

What is Multiple Linear Regression and How Can it be Helpful for Business Analysis?

Smarten

This article describes the analytical technique of multiple linear regression. What is Multiple Linear Regression Analysis? To better understand multiple linear regression, let’s look at one such analysis of independent variables: Temperature and Humidity, and a target variable (yield). Use Case – 1. About Smarten.

article thumbnail

Augmented Analytics Algorithms and Techniques: Learning for Citizen Data Scientists

Smarten

This article summarizes our recent article series on the definition, meaning and use of the various algorithms and analytical methods and techniques used in predictive analytics for business users, and in augmented data preparation and augmented data discovery tools. Use Case(s): Weather Forecasting, Fraud Analysis and more.

article thumbnail

Business Intelligence Examples Show You the Real BI World

FineReport

Business Intelligence(BI) is defined as the concept of using modern data warehouse technology, online analysis and processing technology, data mining and data display technology for data analysis to achieve business value. Real-world examples of business intelligence. Supply chain business intelligence examples.

article thumbnail

Top 10 Key Features of BI Tools in 2020

FineReport

The metadata here is focused on the dimensions, indicators, hierarchies, measures and other data required for business analysis. If you want to learn more about chart types, this article is for your reference: Top 16 Types of Chart in Data Visualization. Drill-down map made with FineReport. Support mobile display. of BI pages.

article thumbnail

Financial Dashboard: Definition, Examples, and How-tos

FineReport

In today’s dynamic business environment, gaining comprehensive visibility into financial data is crucial for making informed decisions. In this article, we will explore the concept of a financial dashboard, highlight its numerous benefits, and provide various kinds of financial dashboard examples for you to employ and explore.