Remove Article Remove Predictive Modeling Remove Statistics Remove Visualization
article thumbnail

3 Things Citizen Data Scientists Need in Predictive Analytics!

Smarten

The technology research firm, Gartner has predicted that, ‘predictive and prescriptive analytics will attract 40% of net new enterprise investment in the overall business intelligence and analytics market.’ It is meant to identify crucial relationships and opportunities and risks and help the organization to accurately predict: Growth.

article thumbnail

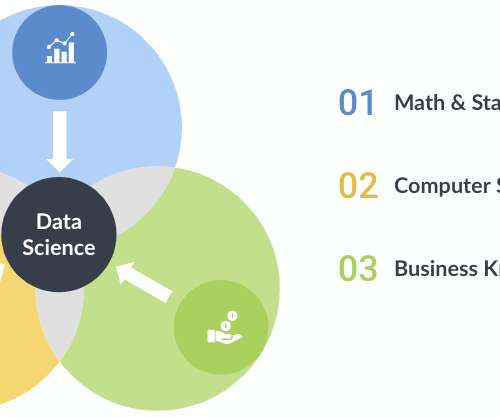
3 Key Components of the Interdisciplinary Field of Data Science

Domino Data Lab

Through a marriage of traditional statistics with fast-paced, code-first computer science doctrine and business acumen, data science teams can solve problems with more accuracy and precision than ever before, especially when combined with soft skills in creativity and communication. Math and Statistics Expertise.

Insiders

Sign Up for our Newsletter

This site is protected by reCAPTCHA and the Google Privacy Policy and Terms of Service apply.

article thumbnail

Data science vs. machine learning: What’s the difference?

IBM Big Data Hub

Areas making up the data science field include mining, statistics, data analytics, data modeling, machine learning modeling and programming. Ultimately, data science is used in defining new business problems that machine learning techniques and statistical analysis can then help solve. appeared first on IBM Blog.

article thumbnail

R vs Python: What’s the Best Language for Natural Language Processing?

Sisense

R is a tool built by statisticians mainly for mathematics, statistics, research, and data analysis. It’s quite popular for its visualizations: charts, graphs, pictures, and various plots. These visualizations are useful for helping people visualize and understand trends , outliers, and patterns in data. R libraries.

article thumbnail

What is the Independent Samples T Test Method of Analysis and How Can it Benefit an Organization?

Smarten

This article focuses on the Independent Samples T Test technique of Hypothesis testing. The independent sample t-test is a statistical method of hypothesis testing that determines whether there is a statistically significant difference between the means of two independent samples. About Smarten.

Testing 40
article thumbnail

What is Karl Pearson Correlation Analysis and How Can it be Used for Enterprise Analysis Needs?

Smarten

This article explains the Karl Pearson Correlation method of analysis, and how it can be applied in business. Correlation is a statistical measure that indicates the extent to which two variables fluctuate together. What is the Karl Pearson Correlation Analytical Technique?

article thumbnail

What is Simple Linear Regression and How Can an Enterprise Use this Technique to Analyze Data?

Smarten

This article describes the Simple Linear Regression method of analysis. Simple Linear Regression is a statistical technique that attempts to explore the relationship between one independent variable (X) and one dependent variable (Y). What is Simple Linear Regression?