article thumbnail

Reporting Solutions: A Complete Guide

FineReport

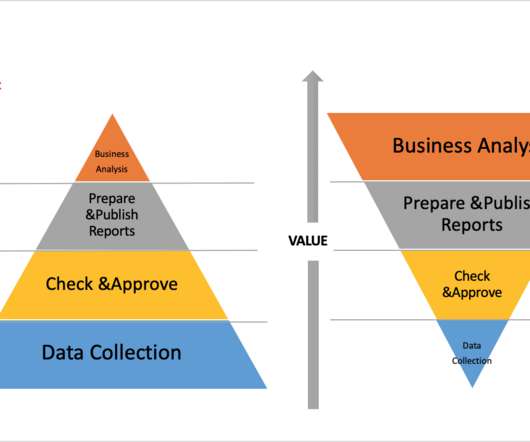
Besides, reporting solutions support managers put together a picture of the relevant data and discover business insides. For most companies, the staffs spend 50% time on data collection, 30% time on checking and approving the data, 15% time on developing and publishing the reports, and 5% on business analysis.

article thumbnail

Business Intelligence Trends: Pathway to Command Future

FineReport

The more you know about business intelligence trends, the more accurate decision-making you will make. Business intelligence trends to future. State of Business Intelligence trends. Provide a new way of data discovery. This is different from any previous ways of collecting data. Conclusion.

Insiders

Sign Up for our Newsletter

This site is protected by reCAPTCHA and the Google Privacy Policy and Terms of Service apply.

Trending Sources

article thumbnail

Financial Statements: Types, Examples, and Analysis

FineReport

Note: All the reports in this article are created using the professional enterprise-level reporting software FineReport. With its user-friendly interface and powerful features, FineReport stands out as the top choice for businesses when selecting financial reporting software.

article thumbnail

Top 10 Key Features of BI Tools in 2020

FineReport

The metadata here is focused on the dimensions, indicators, hierarchies, measures and other data required for business analysis. It also includes some processed data, such as KPI, personal sales, single product sales and other data. The seamless embedding of BI analysis content mainly considers several aspects.

article thumbnail

Financial Dashboard: Definition, Examples, and How-tos

FineReport

Contemporary dashboards surpass basic visualization and reporting by utilizing financial analytics to amalgamate diverse financial and accounting data, empowering analysts to delve further into the data and uncover valuable insights that can optimize cost-efficiency and enhance profitability. Free Download of FineReport 1.

article thumbnail

Human-centered design and data-driven insights elevate precision in government IT modernization

IBM Big Data Hub

The bulk of these uncertainties do not revolve around what software package to pick or whether to migrate to the cloud; they revolve around how exactly to apply these powerful technologies and data with precision and control to achieve meaningful improvements in the shortest time possible.

article thumbnail

What’s the Difference: Quantitative vs Qualitative Data

Alation

What Is Quantitative Data Analysis? Quantitative analysis can take two forms: the traditional business analysis of numerical data, or the more academic quantitative analysis. Traditional business analysis uses numerical methods to paint a picture, often through numerical methods, like statistics.