Remove Business Analysis Remove KPI Remove Metrics Remove Reporting
article thumbnail

Reporting Solutions: A Complete Guide

FineReport

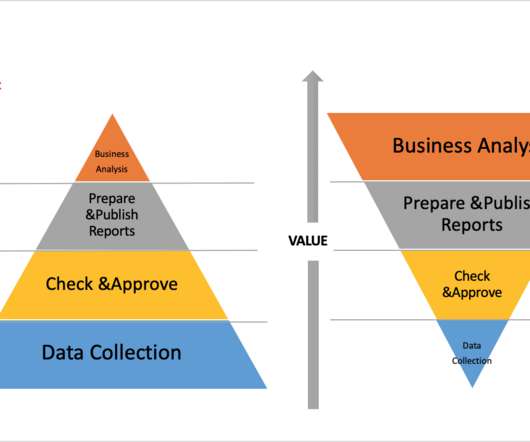
You may have used many tools that have some reporting function built-in. As your business grows, you’ll need complete reporting solutions to handle the fast-changing data and surging reports. Before start, let’s see what are reporting solutions, and what reporting solutions you should look for. .

article thumbnail

Financial Dashboard: Definition, Examples, and How-tos

FineReport

A financial dashboard, one of the most important types of data dashboards , functions as a business intelligence tool that enables finance and accounting teams to visually represent, monitor, and present financial key performance indicators (KPIs). These reports include the cash flow statement, income statement, and balance sheet.

Insiders

Sign Up for our Newsletter

This site is protected by reCAPTCHA and the Google Privacy Policy and Terms of Service apply.

article thumbnail

Why Dashboard Visualization Matters in the 21st century?

FineReport

A visualization dashboard refers to an interactive dashboard that allows the user to track key metrics via different marketing channels, visualize some data points, and create reliable reports for certain purposes. In addition, as the human brain grasps visuals more easily than reports, collaboration seems to be speedy.

article thumbnail

Seize The Power Of Analytical Reports – Business Examples & Templates

datapine

In recent years, analytical reporting has evolved into one of the world’s most important business intelligence components, compelling companies to adapt their strategies based on powerful data-driven insights. What Is An Analytical Report? Your Chance: Want to build your own analytical reports completely free?

Reporting 245
article thumbnail

Analytics Career Advice: Job Titles, Salaries, Technical & Business Roles

Occam's Razor

Michael, politely, says in an email: "I have done web analytics for five years, I have mastered Omniture, WebTrends and Google Analytics, I provide analysis and not just reporting. Or atleast 40% of the time you are a true Analysis Ninja, even if 60% of the time you are a glorified Reporting Squirrel!

Analytics 115
article thumbnail

Business Intelligence Dashboard Software: Make Business Successful

FineReport

Business intelligence dashboard is a common module that general business intelligence has to realize data visualization. Be more specific, it is a data virtualization tool that shows the status of measurement information and key business indicators (KPI) to enterprises. Cost analysis (by FineReport). Advantages.

article thumbnail

Social Media Analytics: Twitter: Quantitative & Qualitative Metrics

Occam's Razor

In this post four twitter analysis tools that while not yet fully developed show sweet signs of: 1. Are not just reporting "hits", rather coming up with clever metrics. Quantitative Metrics / Analyses. While on the surface they might seem useful, I am always suspicious of compound metrics.

Metrics 124