article thumbnail

A Guide To The Methods, Benefits & Problems of The Interpretation of Data

datapine

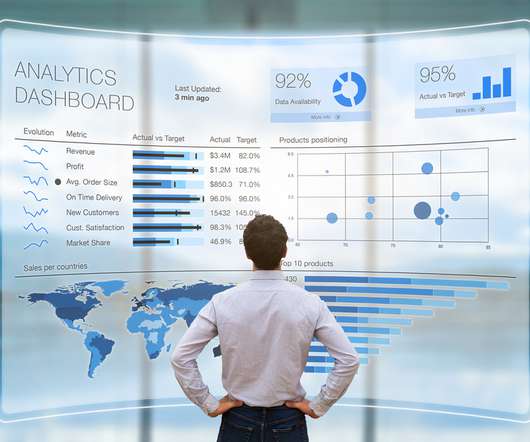
Through the art of streamlined visual communication, data dashboards permit businesses to engage in real-time and informed decision-making and are key instruments in data interpretation. Exclusive Bonus Content: Download Our Free Data Analysis Guide. Exclusive Bonus Content: Download Our Free Data Analysis Guide.

article thumbnail

The Power Of Real Time Analytics & Business Intelligence Explained

datapine

Download our executive, pocket-sized guide to real time BI and analytics! What Is Real Time Business Intelligence? Real time BI is the application of analytics and data processing tools to gain insight into relevant data and visualizations as they’re created. b) Retail store dashboard. click to enlarge**.

Insiders

Sign Up for our Newsletter

This site is protected by reCAPTCHA and the Google Privacy Policy and Terms of Service apply.

Trending Sources

article thumbnail

Business Intelligence and Analytics: Definitive Guide

FineReport

Free Download. Business Intelligence. As we mentioned earlier in the article of BI Reporting , Business Intelligence(BI) can be broadly referred to as a process of managing data and delivering messages from data. Business Analytics. What is the difference between business intelligence and analytics?

article thumbnail

Take Advantage Of The Top 16 Sales Graphs And Charts To Boost Your Business

datapine

Download our free executive summary and boost your sales strategy! This gives to that sales graph an overall sense of visual contrast which makes it much more digestible at a glance. Download our free executive summary and boost your sales strategy! Download our free executive summary and boost your sales strategy!

Sales 235
article thumbnail

Top Data Science Tools That Will Empower Your Data Exploration Processes

datapine

To fully leverage the power of data science, scientists often need to obtain skills in databases, statistical programming tools, and data visualizations. Exclusive Bonus Content: Download Our Free Data & Science Checklist! provides the user with visualizations, code editor, and debugging. Let’s get started.

article thumbnail

Top 5 Report Maker Software & Reporting Software

FineReport

On top of these, FineReport’s data visualization package offers a wide variety of visualization options such as 3D charts, maps, GIS relationships, dashboards. Free Download. Therefore, it is specially prepared for learners or anyone who is interested in data visualization and has no privacy issues. Free Download.

article thumbnail

Business Intelligence and Analytics: Definitive Guide

FineReport

Free Download. Business Intelligence. As we mentioned earlier in the article of BI Reporting , Business Intelligence(BI) can be broadly referred to as a process of managing data and delivering messages from data. Business Analytics. What is the difference between business intelligence and analytics?